
Enhancing Lead Quality in Construction SAAS (How did we increase Product Demo Request calls from 5% to 44.98%?)
💪🏻 This was the project that I (Akash Bulbule) and my fellow PM (Gagan BT) identified during our Journey in Powerplay, Aimed to increase and surpass our sales goals (On experimental bases)
About Powerplay
Powerplay is a B2B SaaS Product brings Tech solutions in Construction industry in India
Project Execution tool helping construction owners to Make more profits.
How?Helping in completing Projects on time
Better use of Resources (Material & Labour)
Powerplay helps Manage different sectors in construction Task + Attendance + Material + Expense
Enhance Communication between site and office teams, and improve overall Efficiency for construction projects, from planning and scheduling to tracking and reporting
PROBLEM 🕵🏻♂️
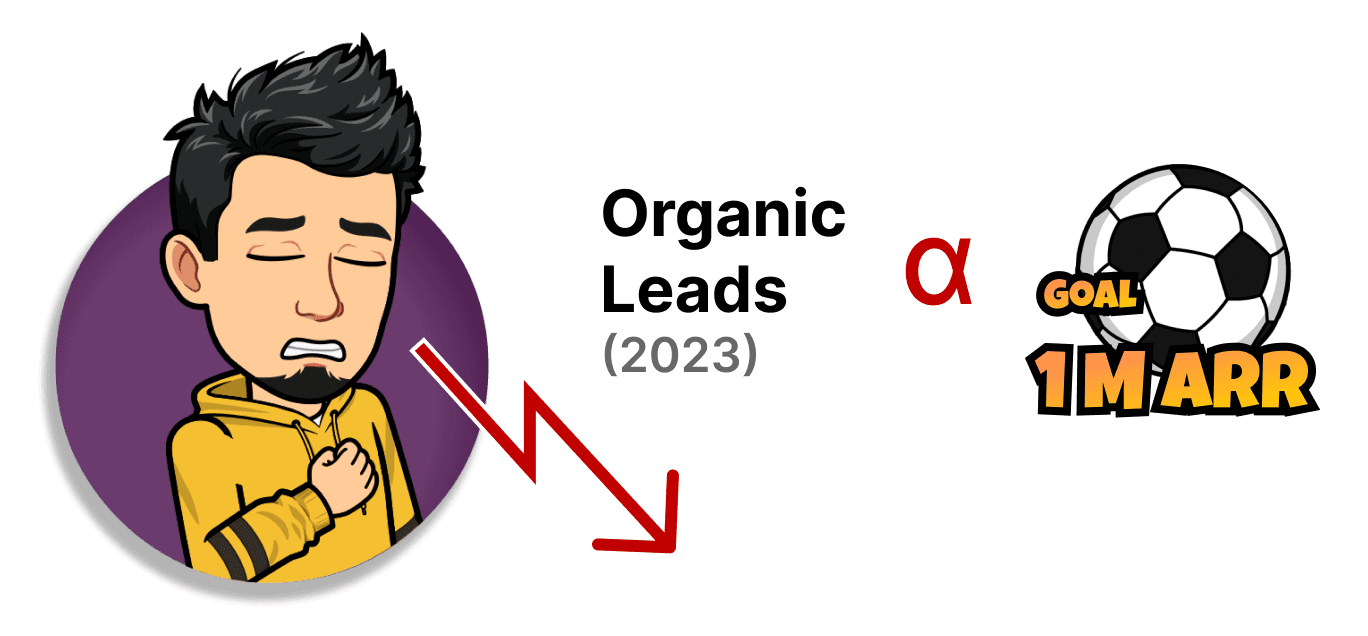
According to April reports of 2023, Our existing strategy of obtaining Organic Quality leads solely from products, without any pre-sales intervention, had proven Ineffective.
This has led to a Shortfall in the number of Mobile Demo requests scheduled by construction owners, hindering our Major Goal of achieving $1M in Annual Recurring Revenue (ARR).
Demo Request Split
Mobile- 93%, Desktop- 7%
What are other kinds of leads?
DQL (Direct Quality Leads) Possible highly engaging users specifically targeted and reached out by sales team who explain benefits of Powerplay in person
SQL (sales quality lead)/ MQD (Market Quality Leads) Same potential user connected via cold calls
PQL (Product quality lead) ✅ [Focus Area] User who show strong interest by engaging through app on their own who are more likely to pay/ Subscribe to Powerplay on their own
Usually Value realisation is Difficult in SaaS , ie where Demo Calls help to completely convey product value tailored to customers ⚡️
What was the Shortfall seen here?
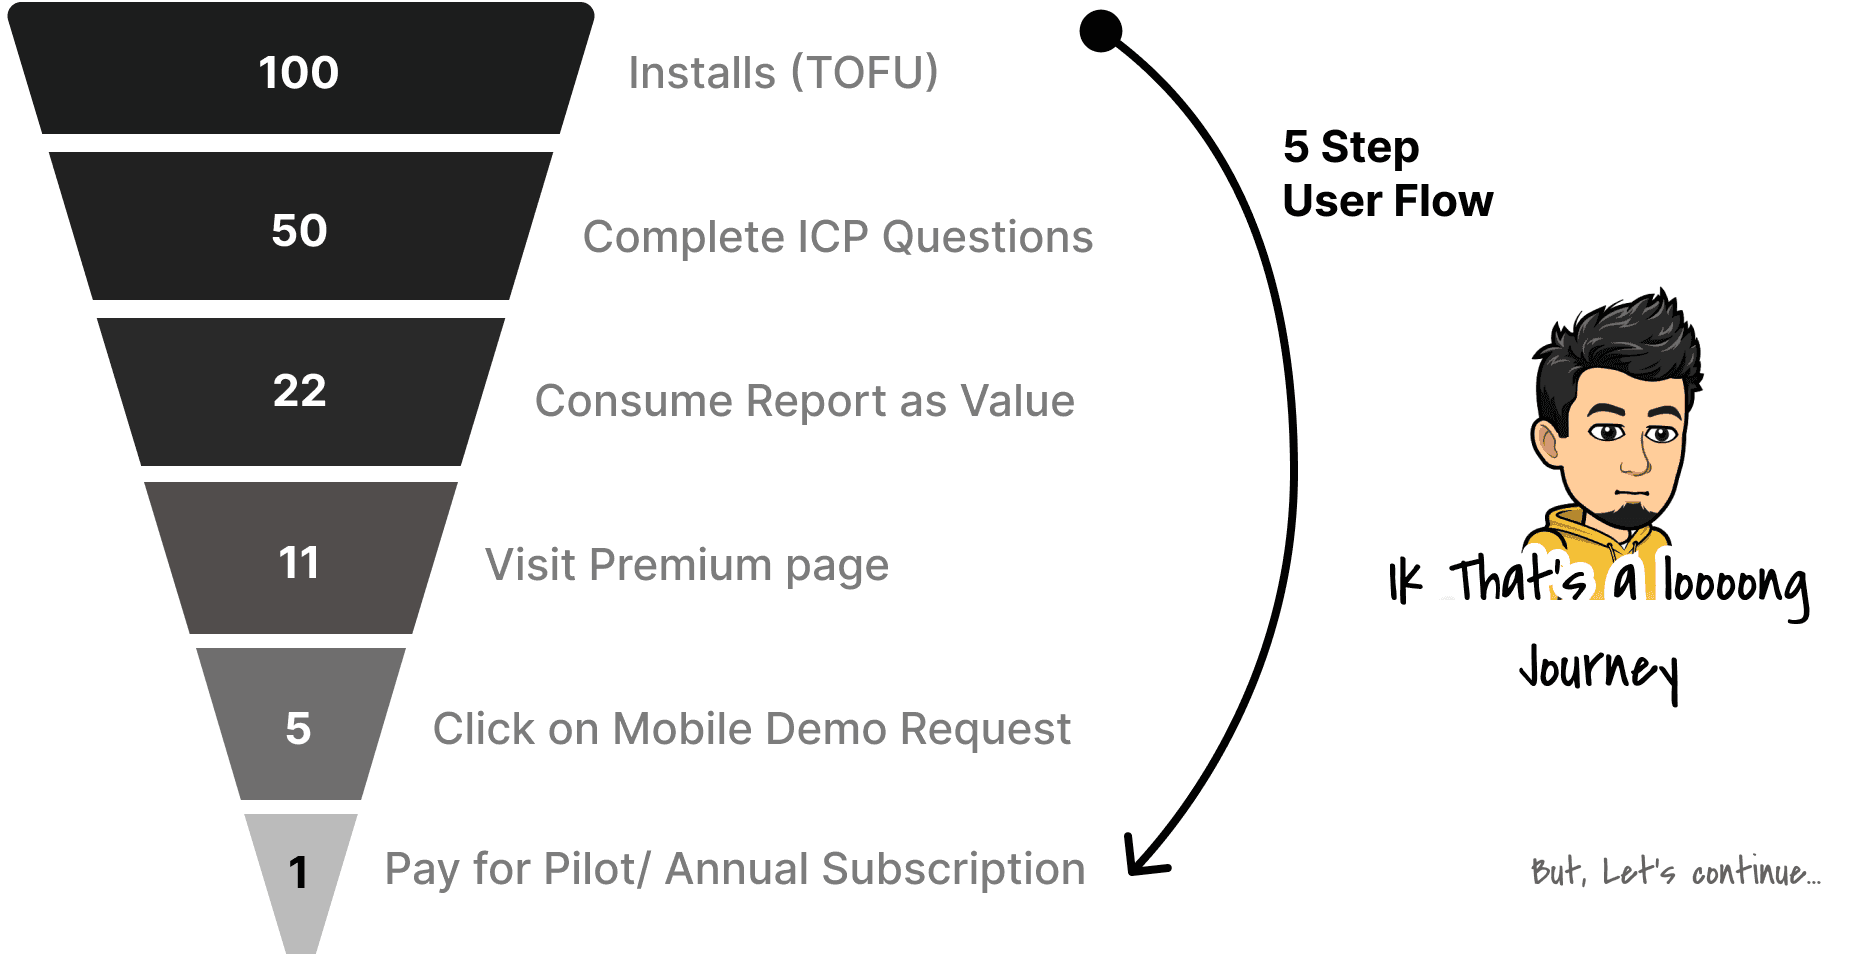
Upon review of our Product funnel, we found that only 5 out of every 100 Founders who installed our application proceeded to click on the "Mobile Demo Request" button, indicating a low conversion rate.
Defined Goal 🥅
Restructure our approach to meet revenue targets by increasing Monthly Demo Requests (MDR) while maintaining current Payment conversion rates and retaining the existing pre-sales manpower.
Who are our Users?
Owner (Subbu) | Office Team (Sam) | Site Team (Raju) |
|---|---|---|
|
|
|
What kind of Owners we had?
ICP Category | Segment | Project Type | Nature of Work | Company Type |
|---|---|---|---|---|
Main ICP (Focus Area ✅) | S1 (1-10 Cr) | Infra,Residential, Commercial | Interior,Turnkey | General Contractor, Builders |
Next ICP (A) | S2 (10-50 Cr) | Infra,Residential, Commercial | Interior,Turnkey | General Contractor, Builders |
Next ICP (B) | S2 (10-50 Cr) | Infra,Residential, Commercial | Base Build | General Contractor, Builders |
Why focus on S1 (1-10 Cr)?
Largest Segment of 60% market
Product built is more specific to them
Release Strategy:
In this project, we specifically targeted S1- founder with 0-10Cr turnover to yield Initial results before expanding our strategies to other ICPs on an Experimental basis.
Now let's see
How construction owners make profit?
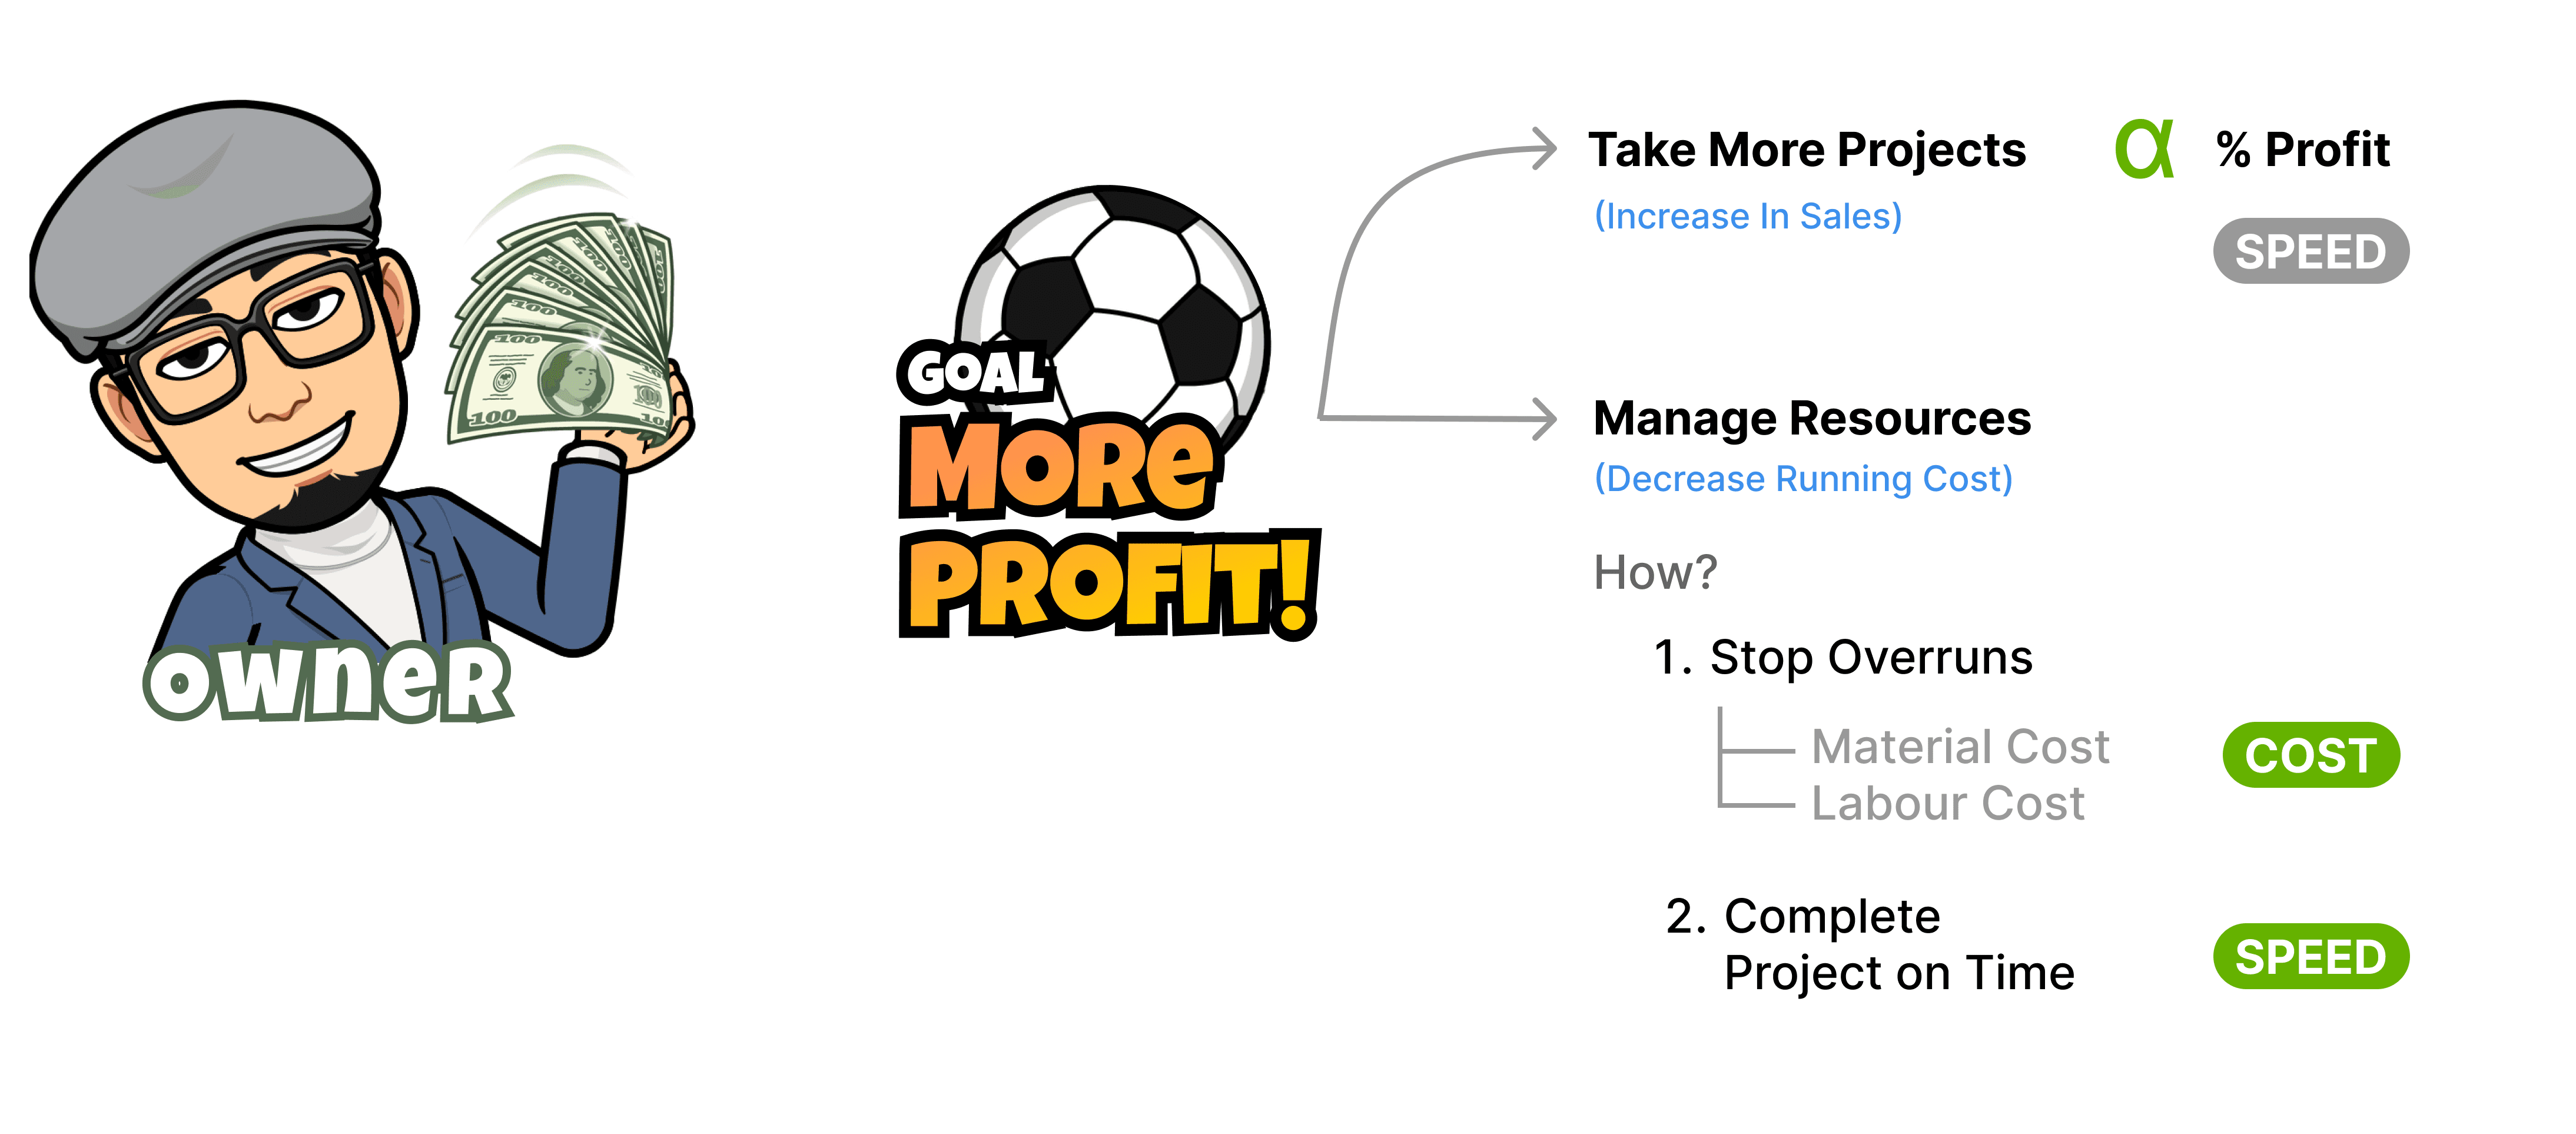
Increase in Sales by increasing working Projects
How?Increase in team size
Accelerate project completion through improved monitoring.
Decrease in Cost (Resource Mgt)
How?Avoid losses in labour, Machine & Materials
Better execution in labour, Machine & Material resources
A) Visibility on Next day work
B) Visibility on Available material inventory Stock
C) Labour v/s Work analysis - Connected payments
D) Choosing right vendor for material ordering
E) Better Communication of Work progress
General Owner Persona:
Construction Owners generally oversees multiple project sites ensuring smooth operation & timely completion. They are moderately tech-savvy & are comfortable using smartphones and basic computer programs.
Painpoints:
Information Overload & Inaccessibility:
Managing data from multiple projects scattered across spreadsheets, emails, and physical documents creates difficulty in accessing and analysing critical information in a timely manner.
Inefficient Decision-Making:
Delays in identifying potential problems and opportunities due to scattered consumption data lead to reactive decisions, increasing project delays and cost overruns.
Communication Silos:
No single space for owners, managers, workers, and clients for communication, which leads to inefficiencies and project delays
Limited Visibility of Project Status:
No one-stop solution to get daily overall project health and resource allocation vs timelines, which hinders proactive decisions for error corrections.
Work-Life Balance Challenges:
Juggling multiple projects and personal responsibilities with fixed timelines is a hassle.
Goals:
Manage multiple project in better
Make Better decision by analysing data fast
Improve communication between teams
Get Visibility on Project progress and identify delays
Reduce Stress and workload associated with information overload.
Let's Recall Our Defined Goal 🥅
Restructure our approach to meet revenue targets by Increasing Monthly Demo Requests (MDR) while maintaining current Payment conversion rates and retaining the existing pre-sales manpower.
How to Improve 🤔?
To improve let understand where our users drop off by navigating through our user funnel for every 100 installs to Understand Areas to improve
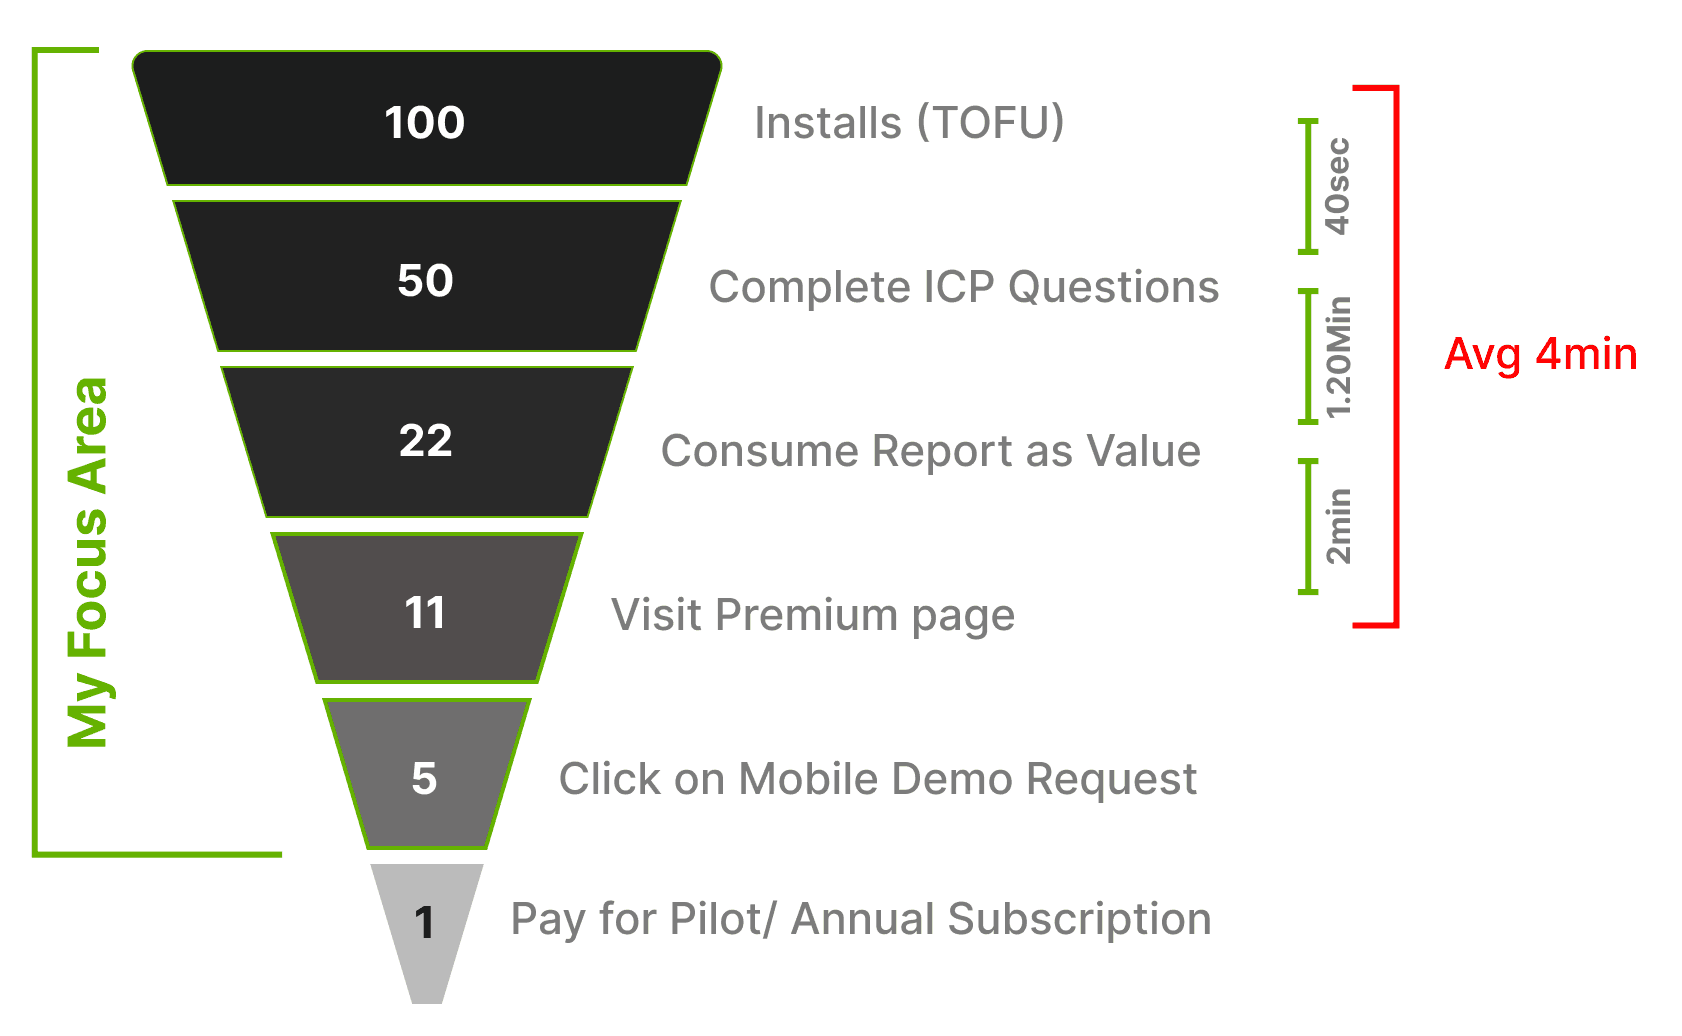
Our existing MDR Funnel / 100 installs
The funnel represented in the right conveys the percentage of Founders entering into each stage.
On average 2.7K/ Month founders install our application and fall into this experiment
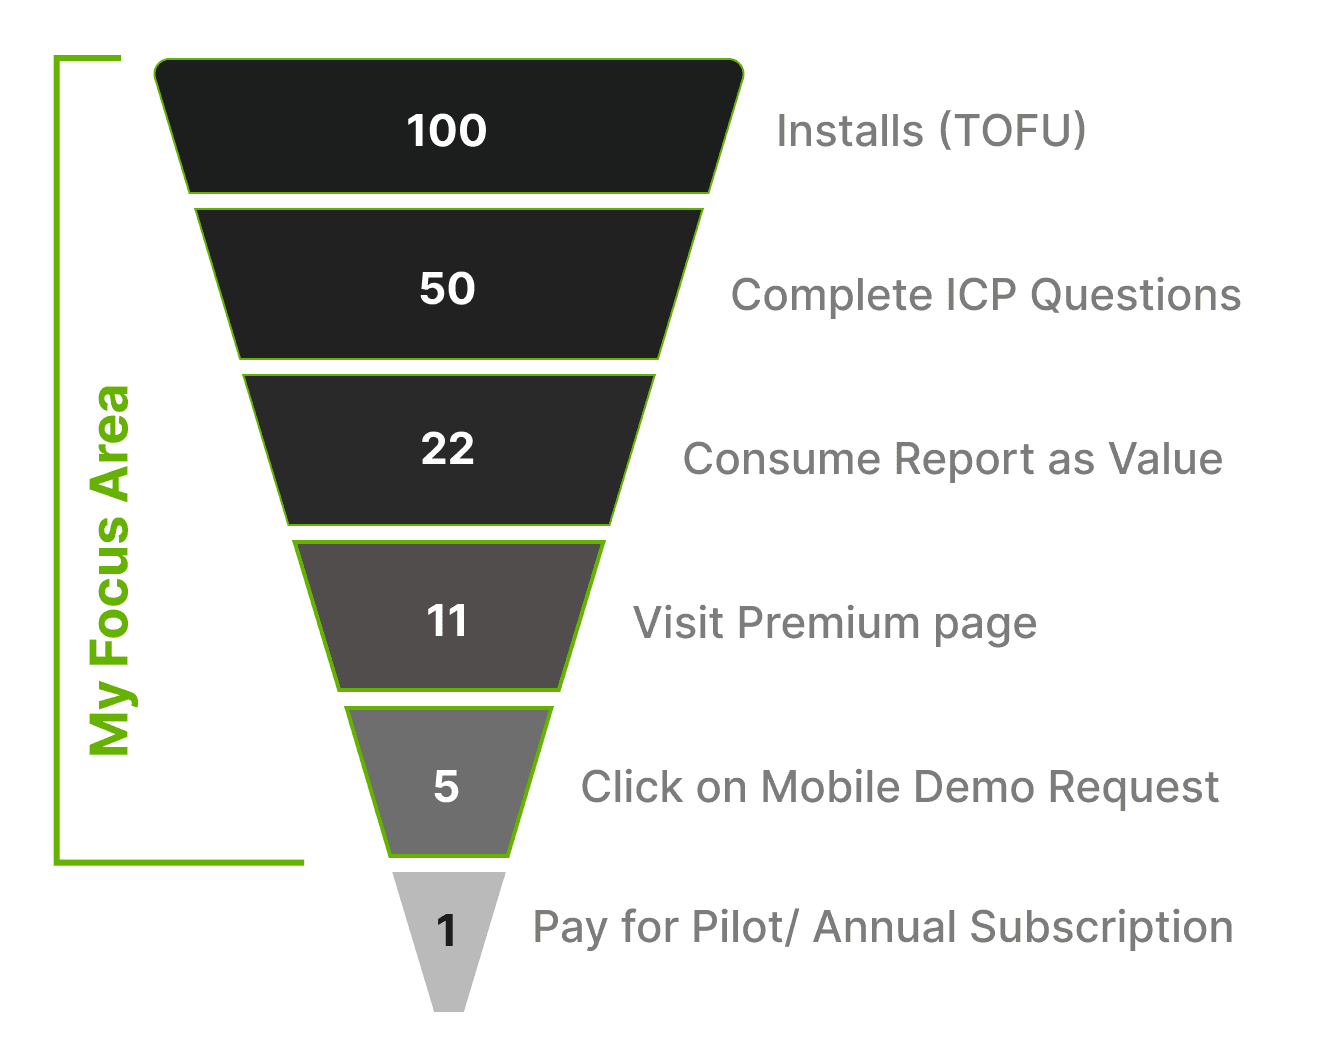
Our Goal- To Increase MDR (Mobile demo request) from 5% to 30%
Direct payments/ Payment after demo/aren't my focus point for this project. Why- 82/ 100 people pay, when sales team get on call.
Problem Breakdown 🏋🏻
To understand why our MDR rates are low, we need to go through the user journey to know their point of view.
Existing Flows & Problems (A, B, C, D)
A) Onboarding Flow Problems
Soon after installing the application, Founders are guided through these onboarding screens
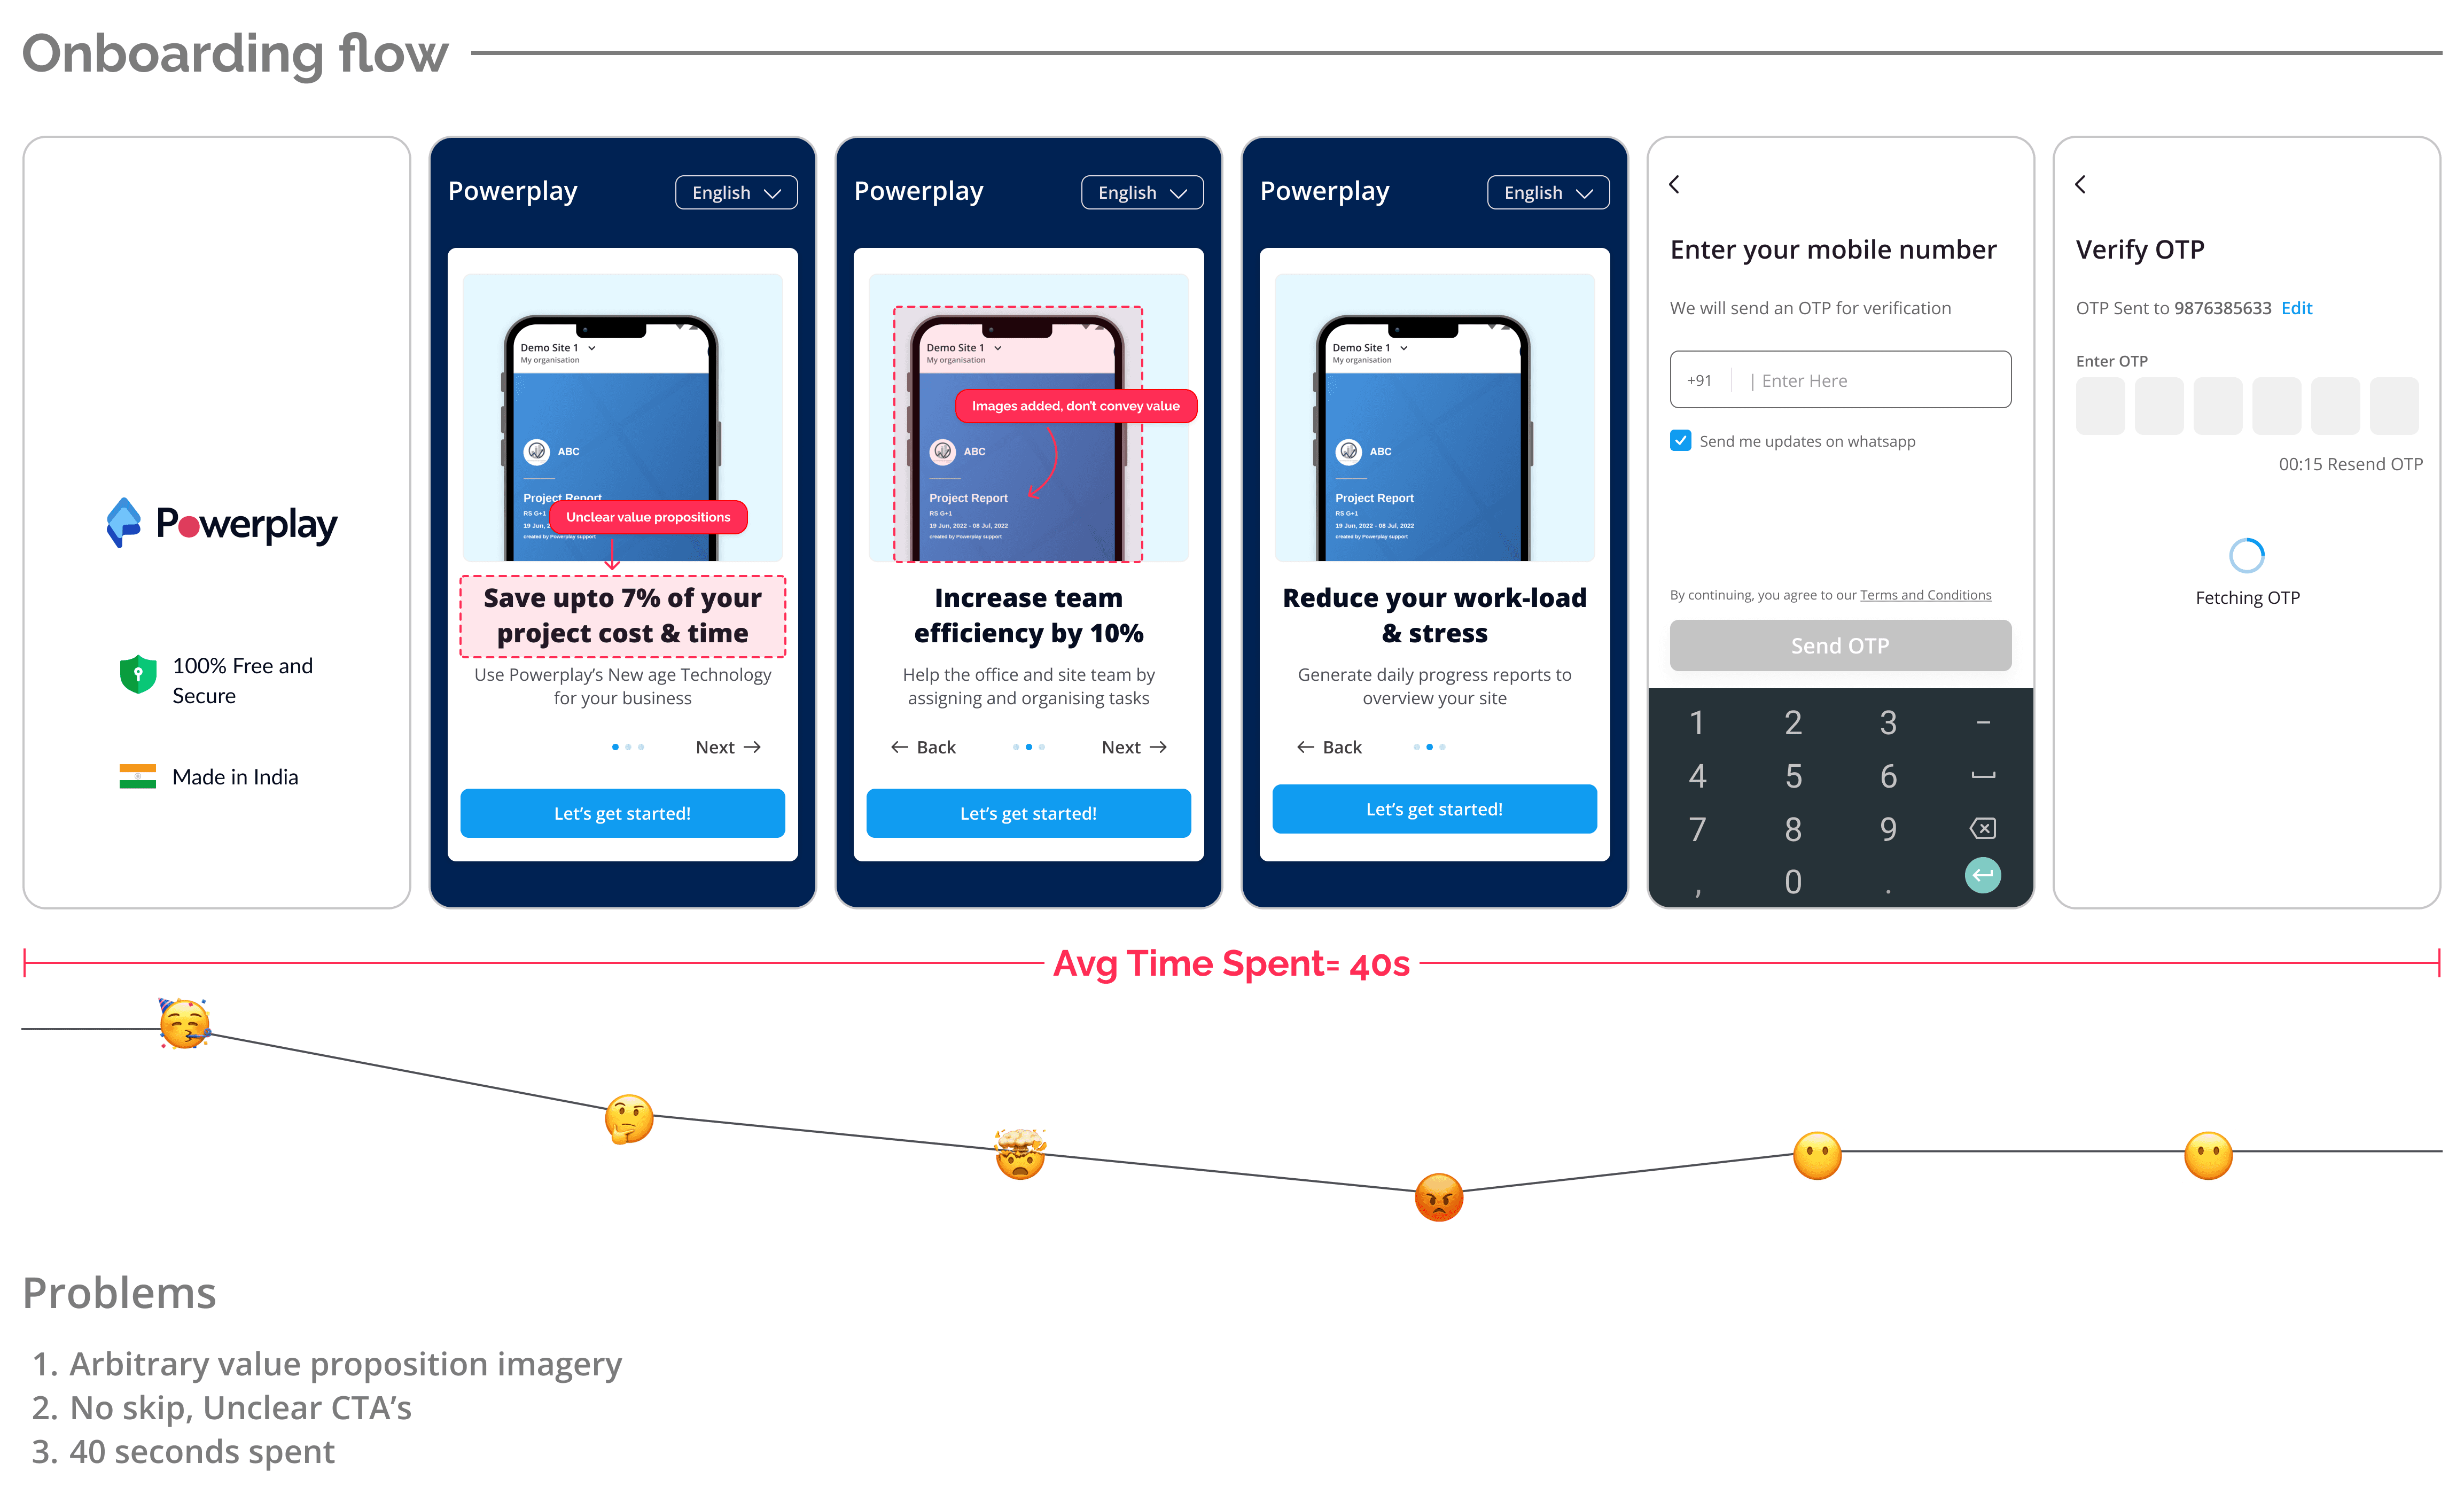

Problems in the flow
Confusing and Arbitrary value proposition imagery
Users are unsure whether they can skip the process due to unclear call-to-action (CTA) prompts
Users spend 40 seconds trying to understand the app's message and move forward
B) Account Setup Problems
Soon after Onboarding flows, Founders are guided through these screens where they set up their account with a few ICP details asked
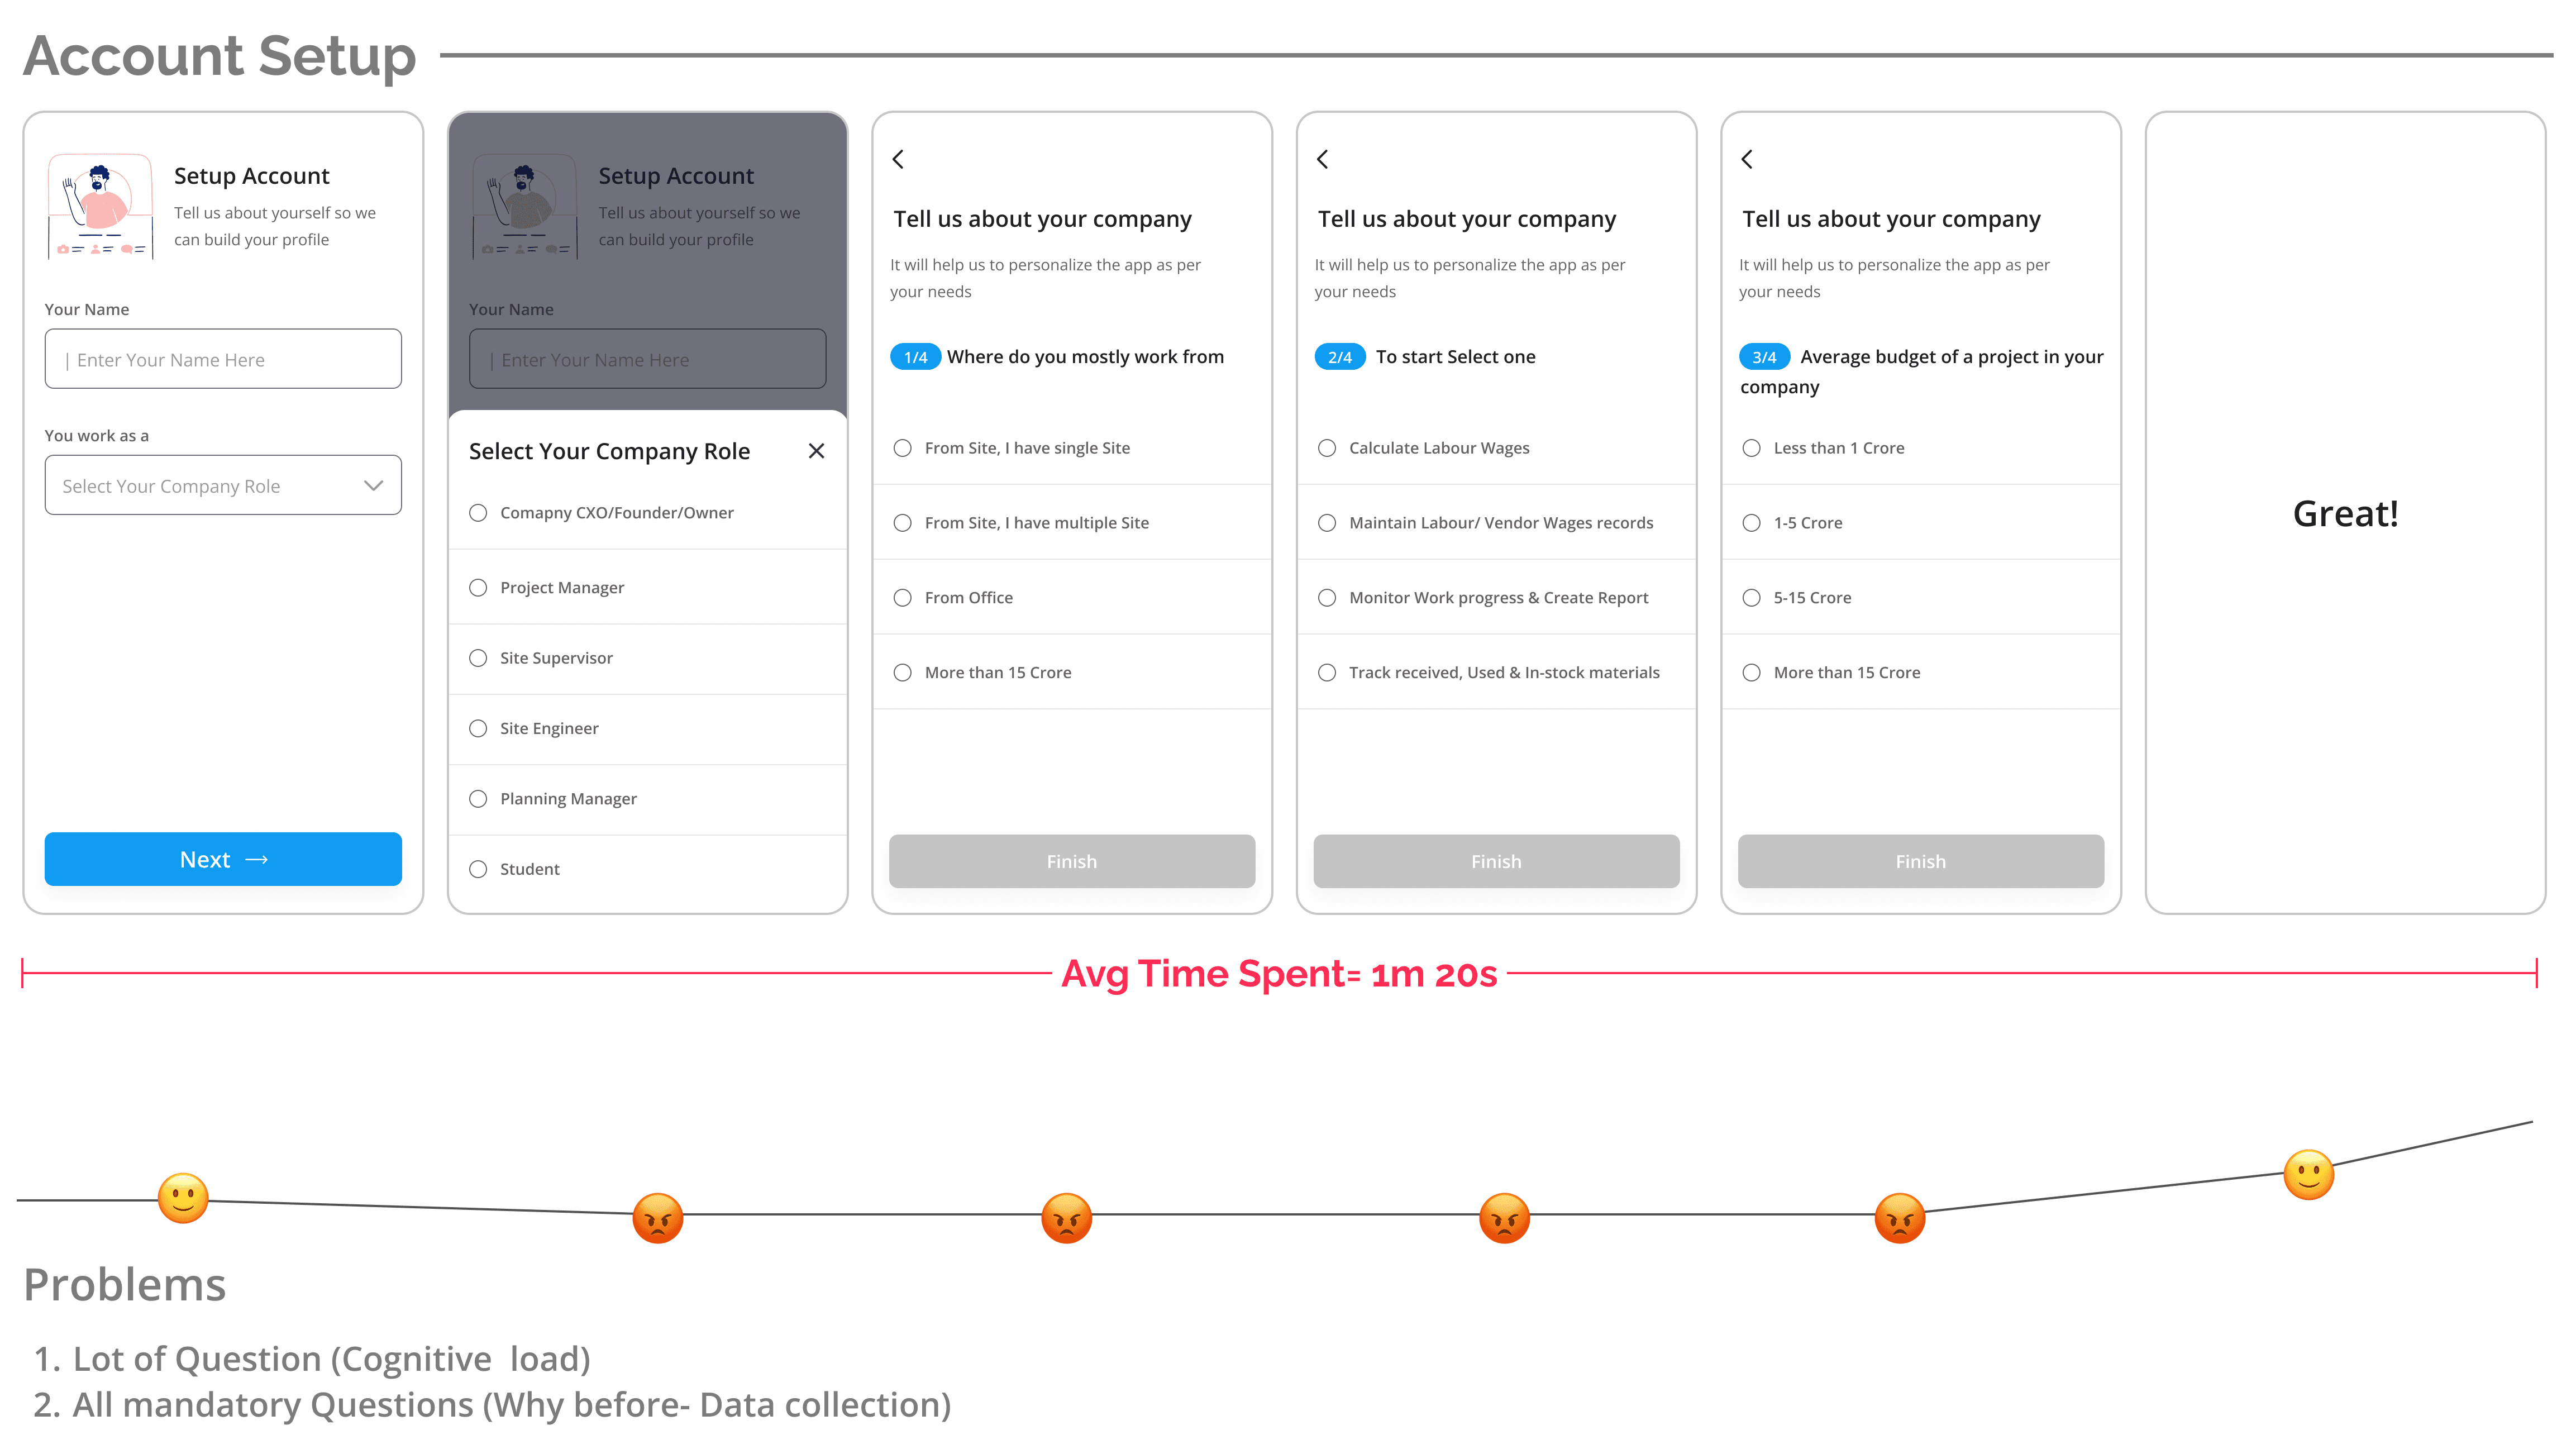

Problems in the flow
Cognitive load due to lot of questions make users loose patience.
All questions are mandatory, scaring users to spend extra time answering them upfront to avoid future concernsWhy did we even had so many question initially? Coz the data points were used for Generative calls for the Product Team to get insights.
C) Value Realisation flow Problems
After setup, Founders are presented with a Daily Progress Report (DPR), typically sent by the site team to the owner. This report serves as a value proposition for the founder, prompting them to take specific actions to achieve similar progress
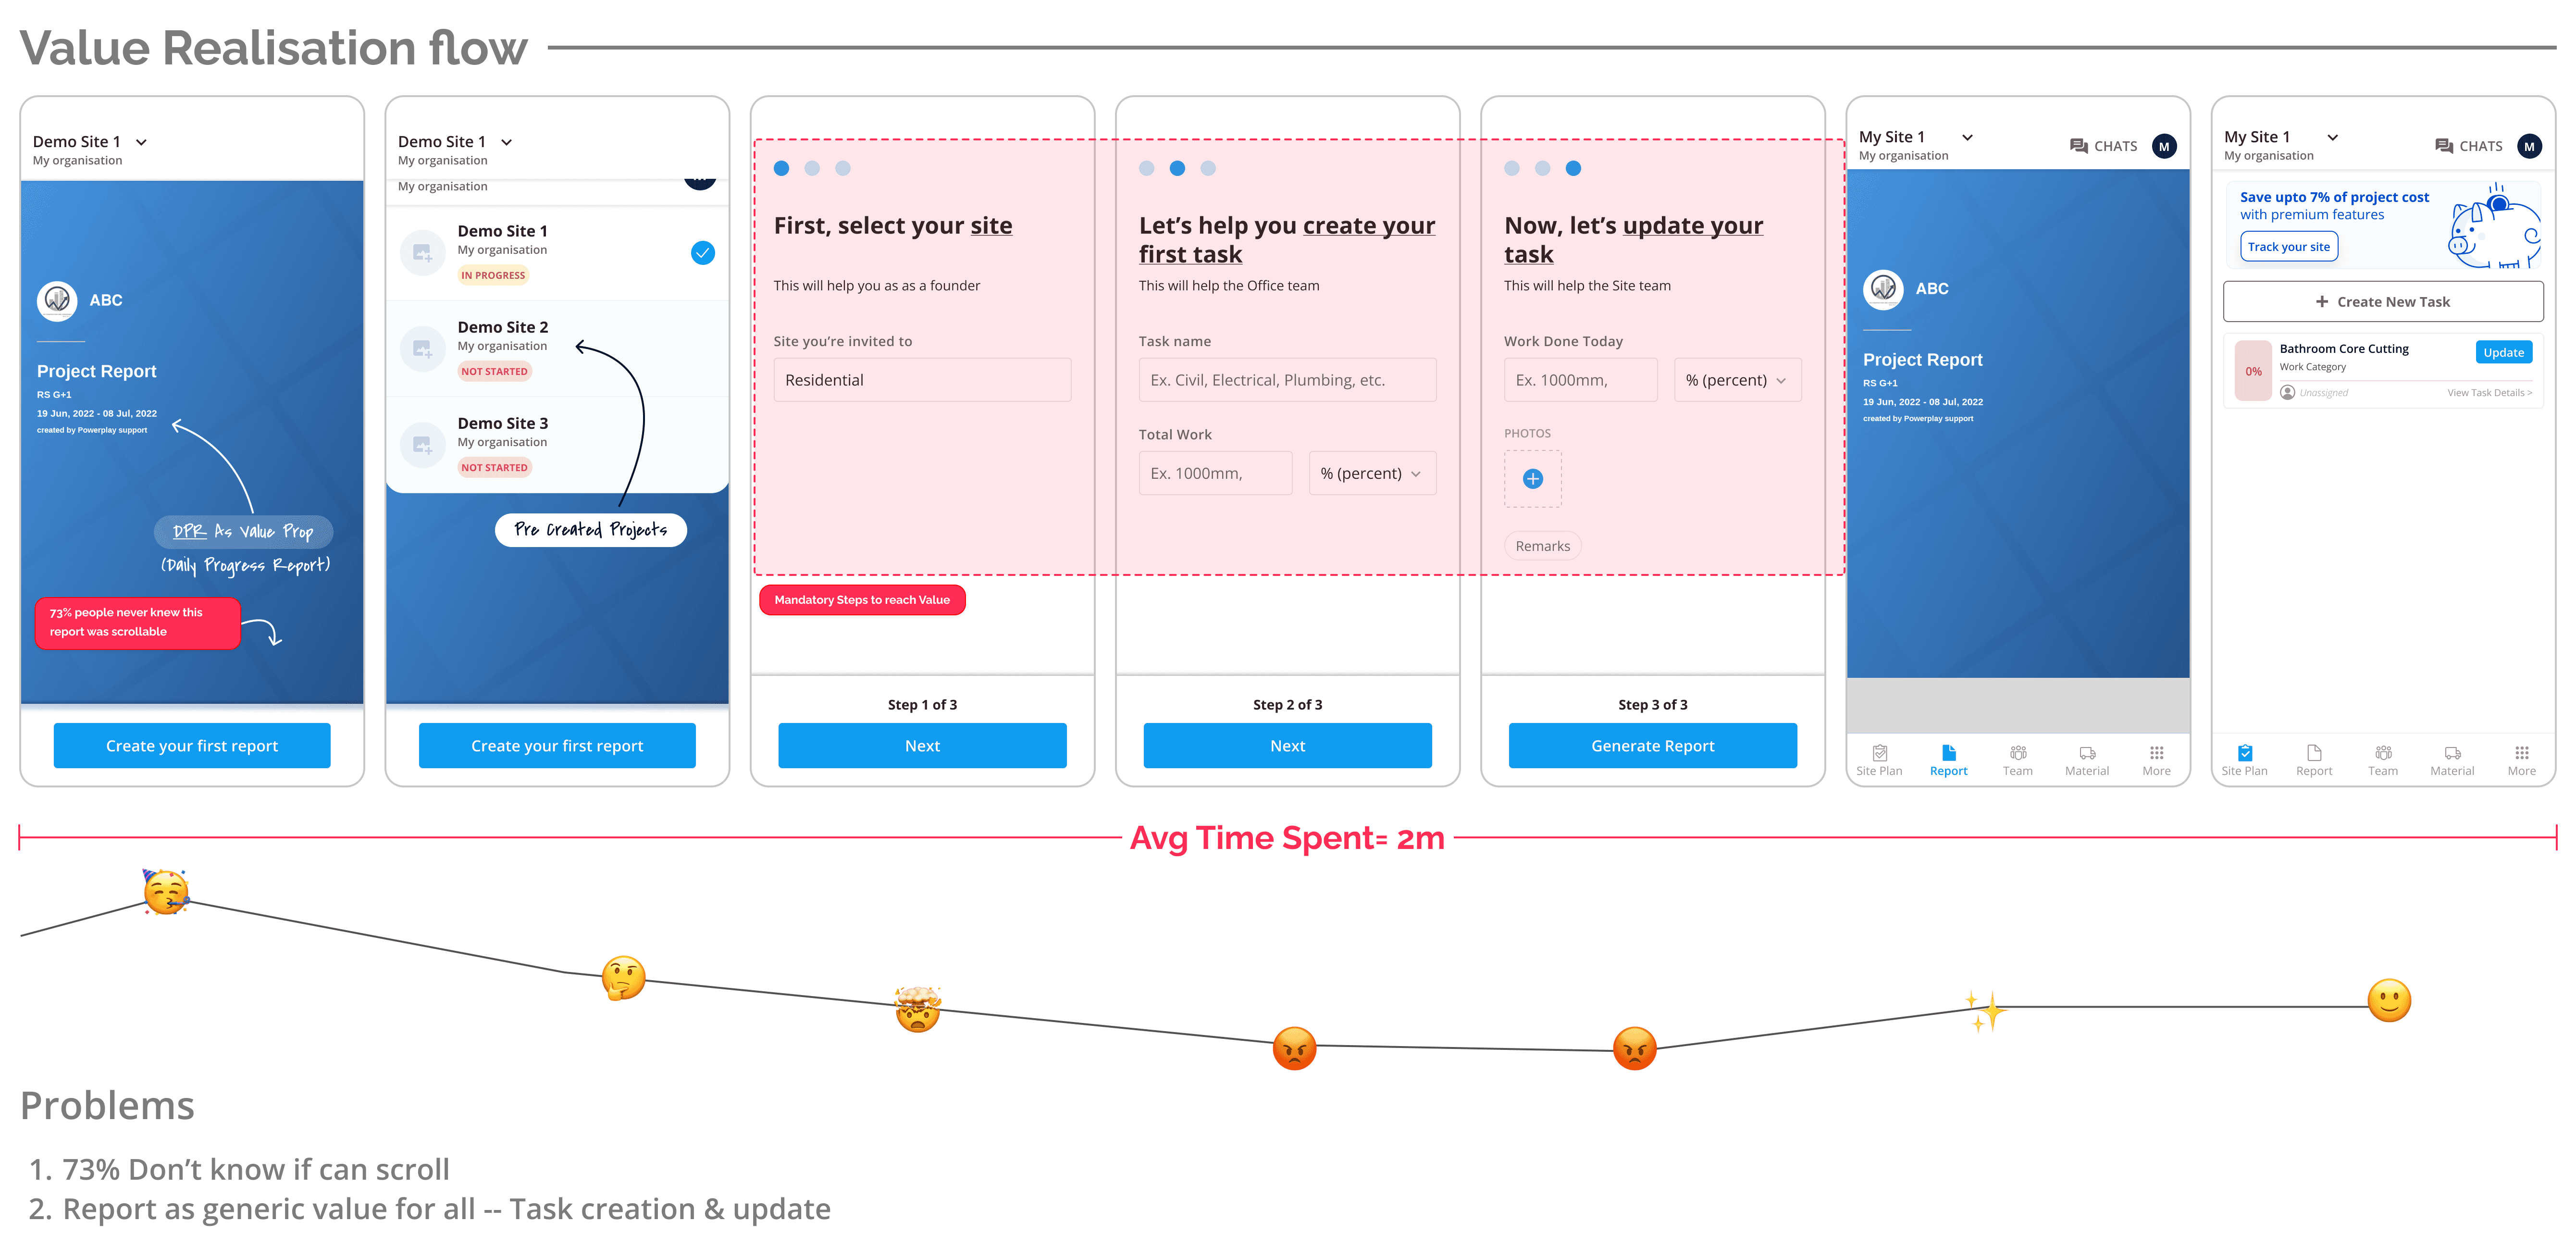

Problems in the flow
73% of founders are Unaware that the DPR report screen was even scrollable, resulting in them not fully benefiting from its intended value
Onboarding all founders onto the task module with the aim of showcasing Reports as value proved to be too generic of a solution. Many founders lost interest as they installed the application seeking solutions tailored to their specific problems.
At the initial stages, most people churn, resulting in such low TOFU engagement that even showcasing reports as value becomes ineffective at this stage.
🚫 Major Issue:
Founders spent an average of 4 minutes navigating to the application, leading to a decrease in Funnel numbers
D) Value prop pages Problems
After exploring the product, if the founder wishes to learn more and clicks on the respective banners within the modules, they encounter the following pages
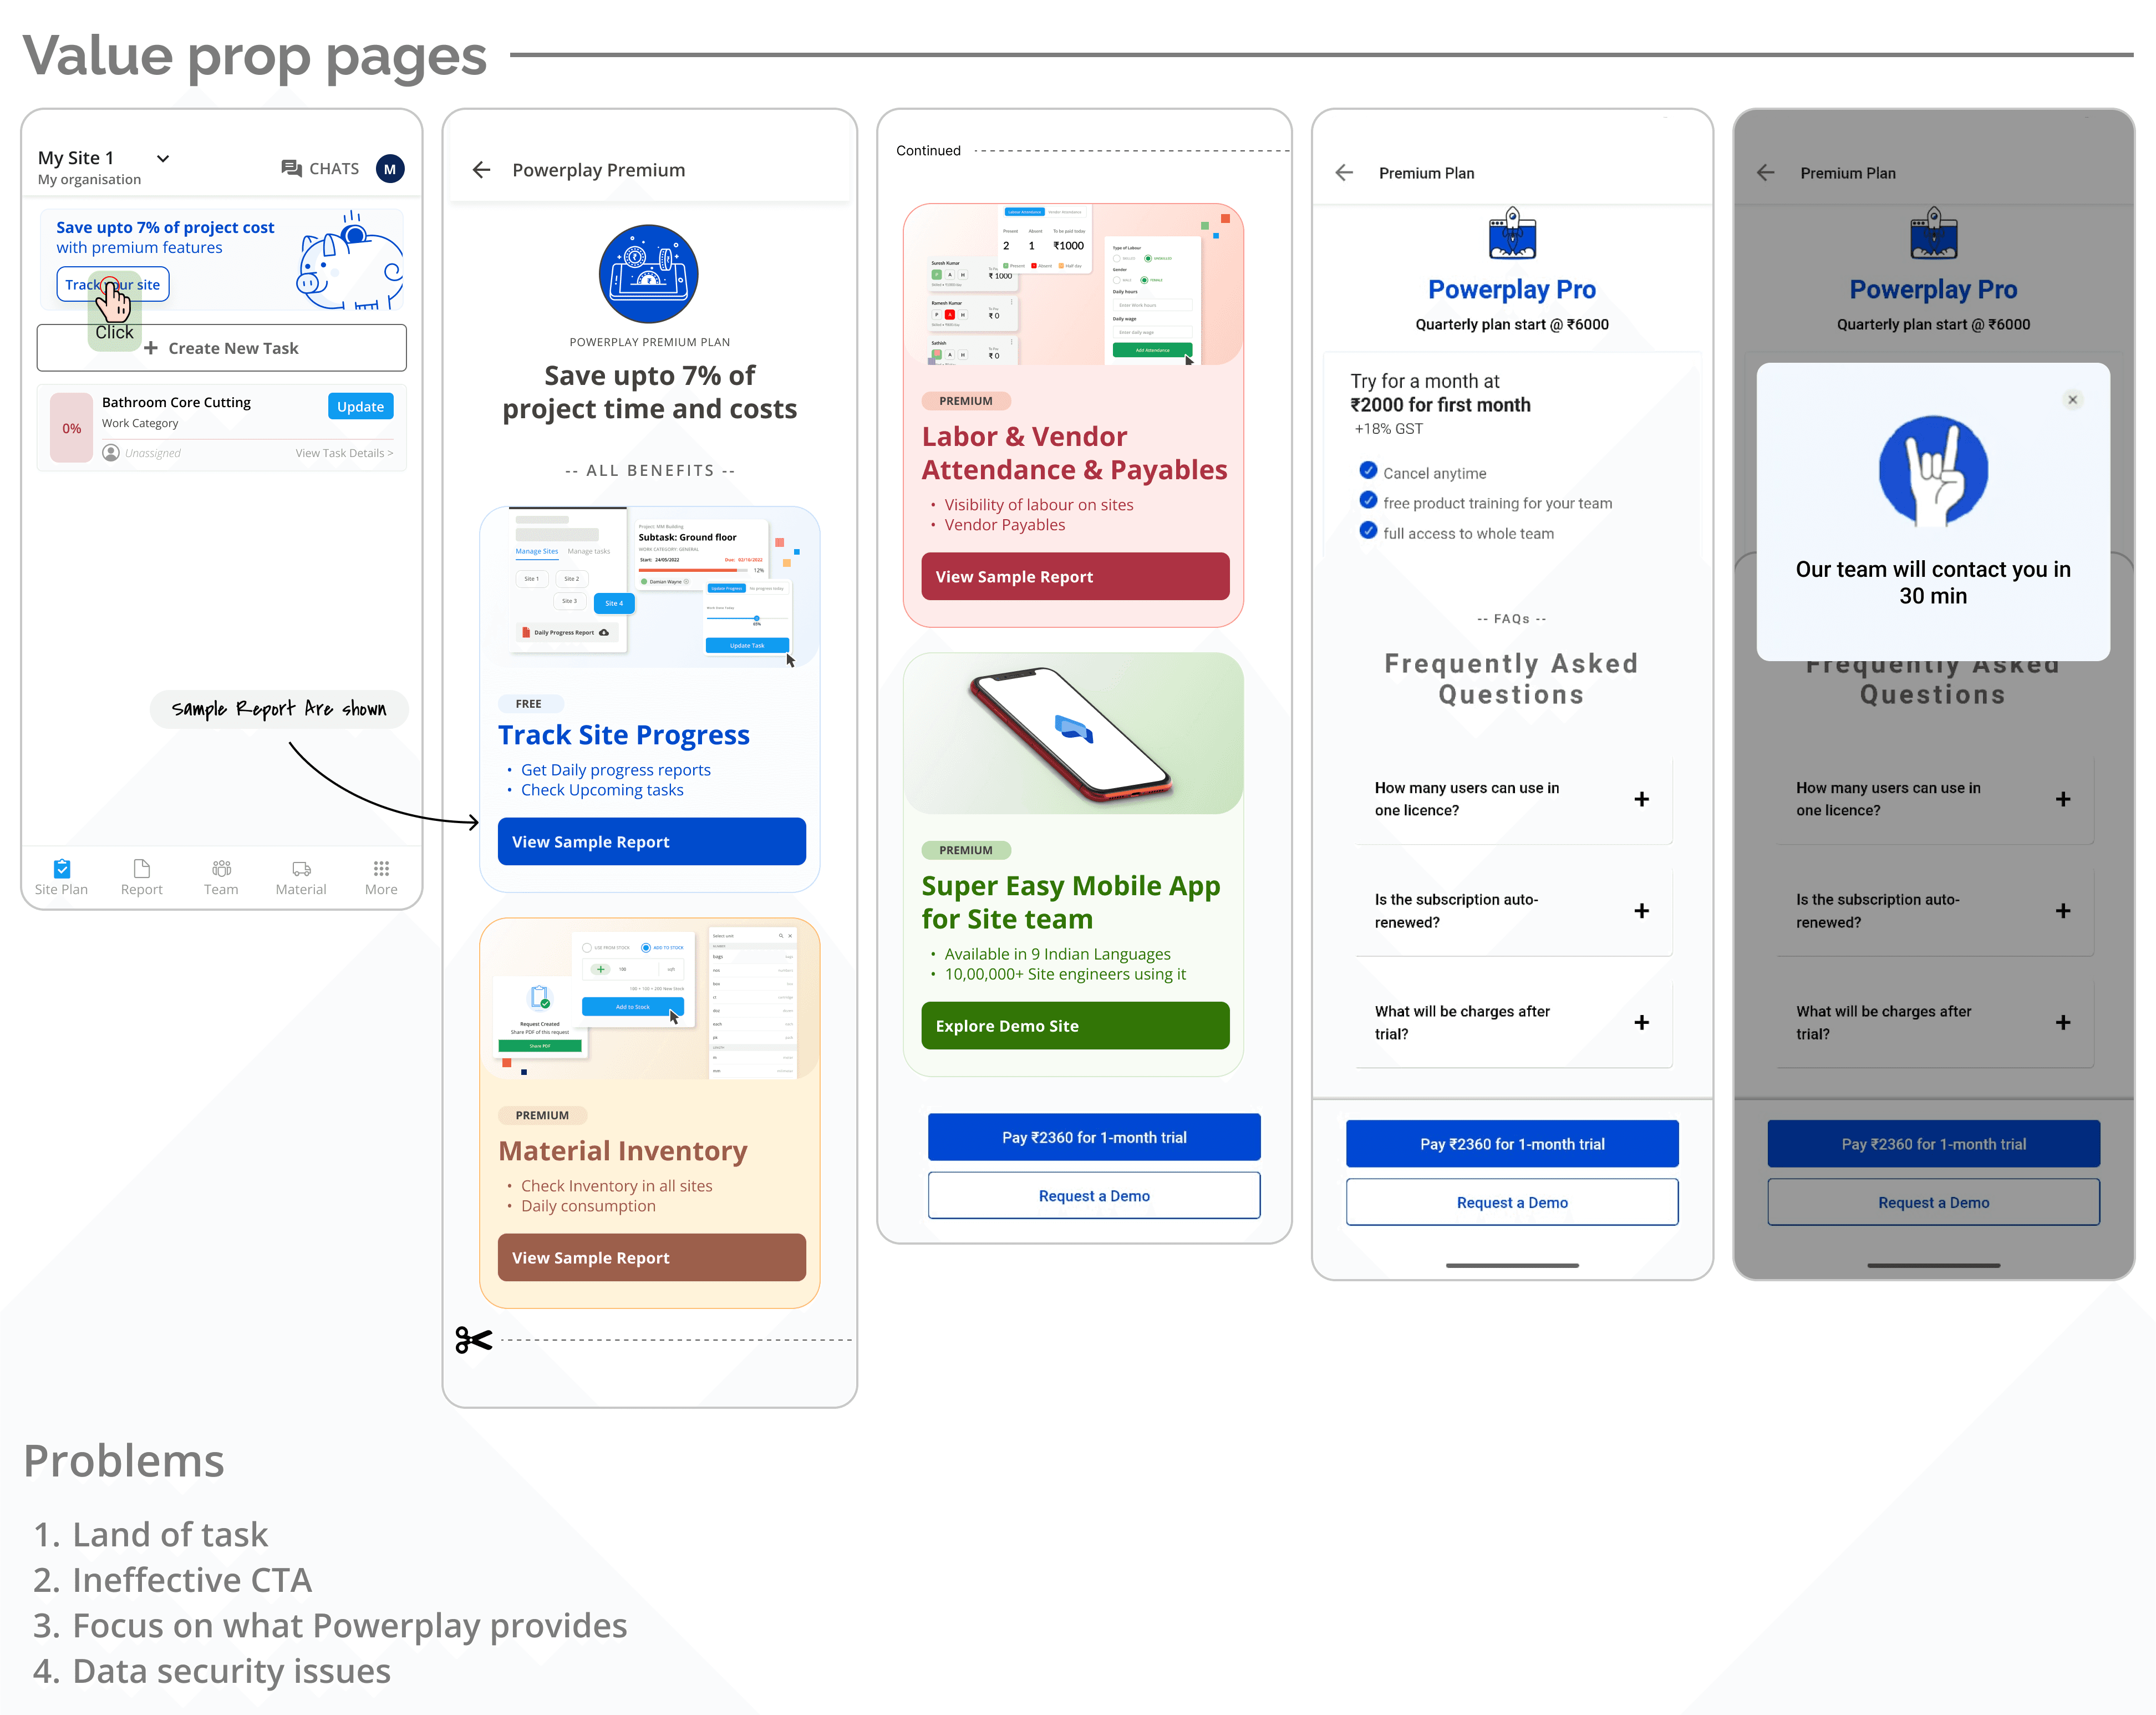

Problems in the flow
Immediately after founders consume the report as a value, we Introduce them to the task module, addressing the same generic problem we discussed in previous flow
Banners from the Task module, directing users to the value screen, had Ineffective call-to-action (CTA) copies.
The second set of value screens built within the Powerplay module, before the payment page, focused more on what Powerplay was providing rather than addressing the problems of founders that the product could solve.
General Question: Why do we even have two sets of value screens? Because people at Powerplay were running experiments before, and they kept what worked best during that period of time
The product didn't convey founders about their Data security from third parties & Data being stored safely.

Now let's dive into
Solution Space 🤿
My role as a Product designer with PM 🤩
32/ 57 User calling on Construction owners to understand the motivations driving their decision to request a demo
Led the understanding User journeys creation of Hypothesis and Interactive Design screens for Value realisation & Discoverability
Worked closely with Designers for visual consistency, PMs for discussions, and the Engineering Team for trade-offs and timelines
Executed Usability testing for internal & External Team and gathered feedback from initial users via Figma Mirror to identify and address issues effectively

Let’s Launch solutions as Experiments?
Why🤔?
We had limited resources (Tech Bandwidth & Time), so we needed to show impact through small experiments before getting full tech support.
Phased delivery helped Keeping things simple & Clear for Tech Team
It allowed us to set Clear Metrics to Track Results.
List of Experiment we ran over Founder Calling Insights
We (Me & PM) Bucket listed the Thoughts owners experience at each stage of onboarding to develop potential hypotheses and test our solutions effectively.
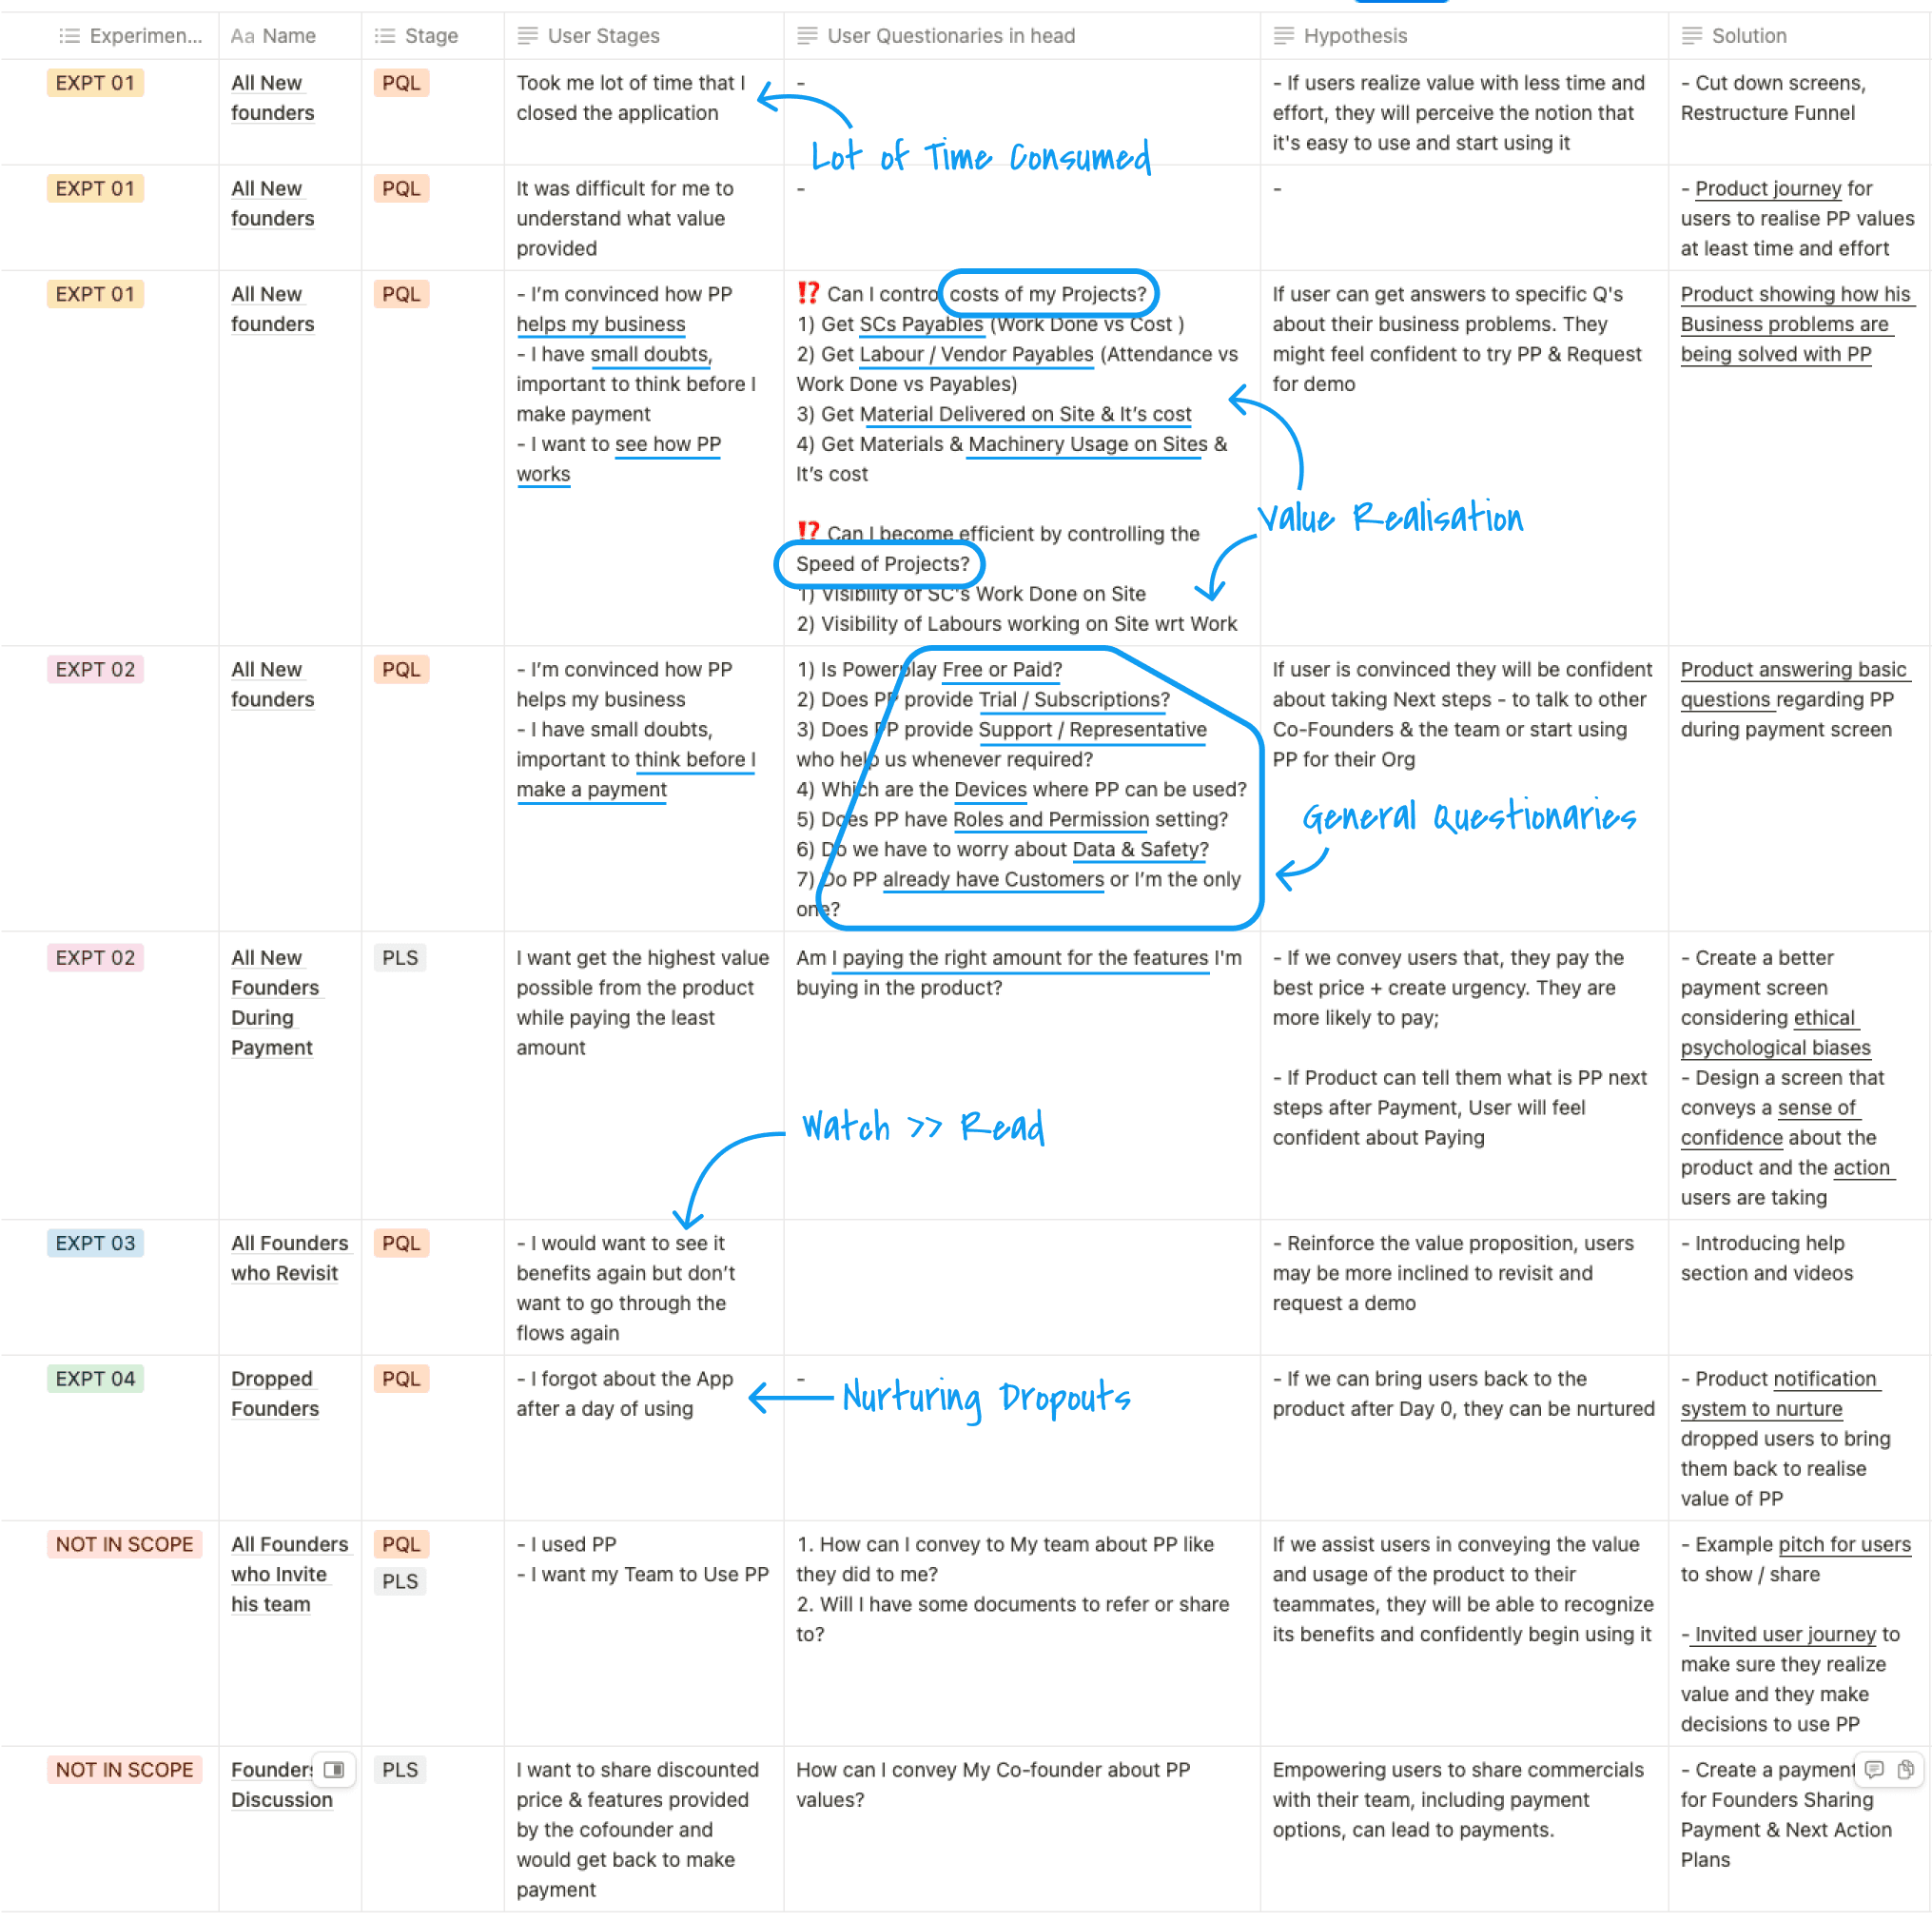
Powerplay's acronym list
PQL- Product Quality Leads
PLS- Product Lead sales
PP- Powerplay
SC’s- Subcontractors
ICP - Ideal Customer profile

EXPT 01
Onboarding Flows & Restructuring funnel with new Value Screens
MDR Impact from EXPT 01 is 5% to 22.65% (Delta created 17.65)
What did we focus on
How can we Reduce onboarding timing and all that cognitive load put on user during onboarding?
How can we make Better conveying value screens?
New Onboarding Screen ✨
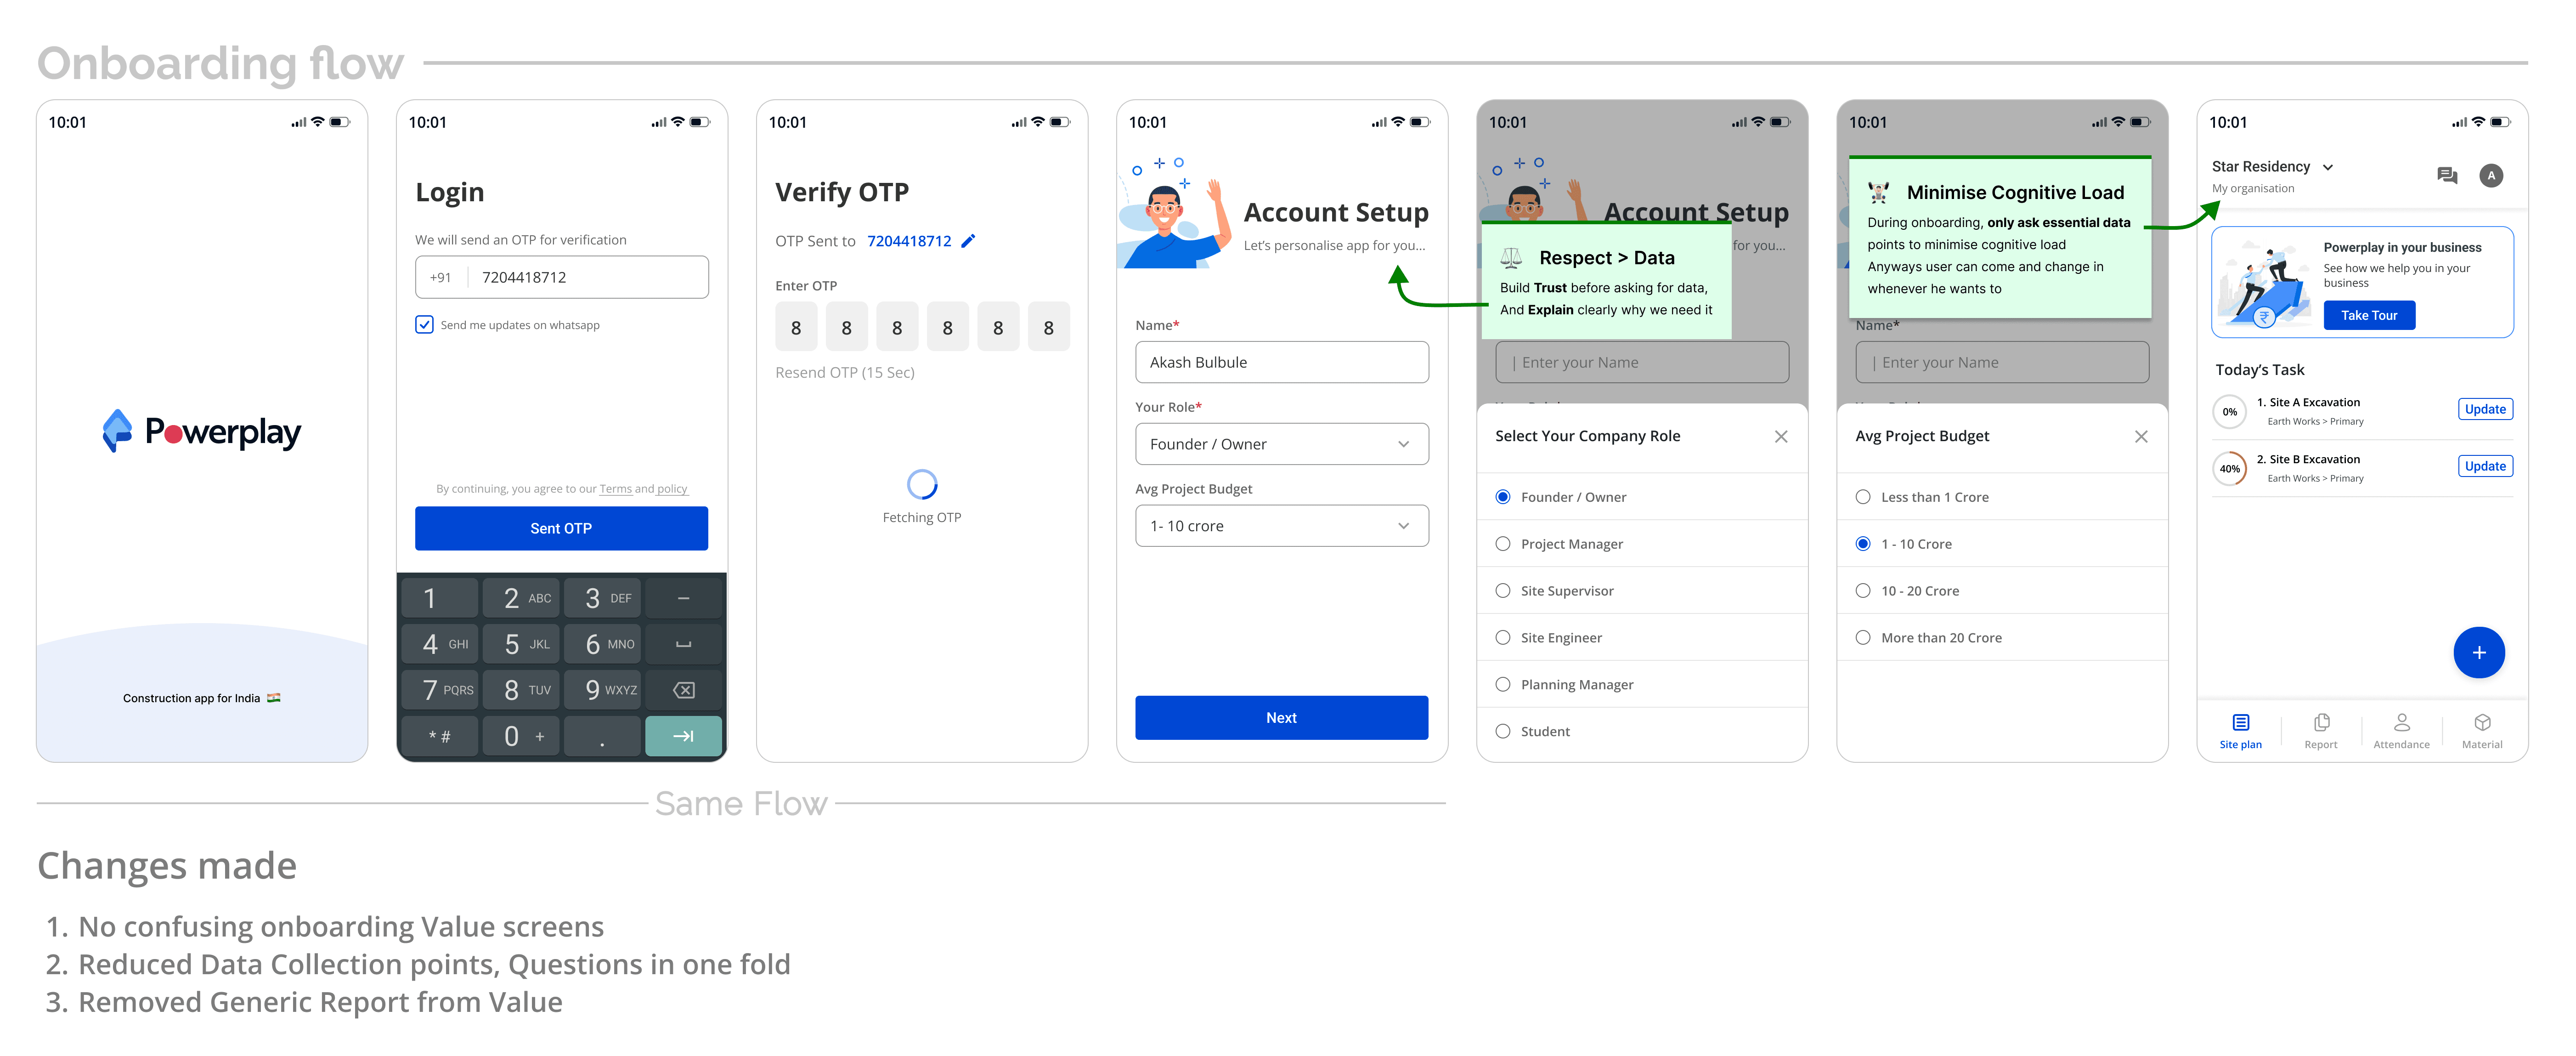
Removed confusing value proposition. Why? User was stuck consuming arbitrary images of what Powerplay has, rather than addressing their occurring problem
We Removed the Initial data points that were used for Generative calls for the Product Team. But now that we know more about user we can concentrate on reducing drop-offs, rather than increasing their cognitive load
and asked required Questions in one fold reducing clicks
We Removed a Generic report displayed as a value screen that wasn't specific to any cohort along with Mandatory Task Questions that a User needs to go through to reach Aha

Reference, only when people go to premium page, they are able to see values
New Value Screens ✨
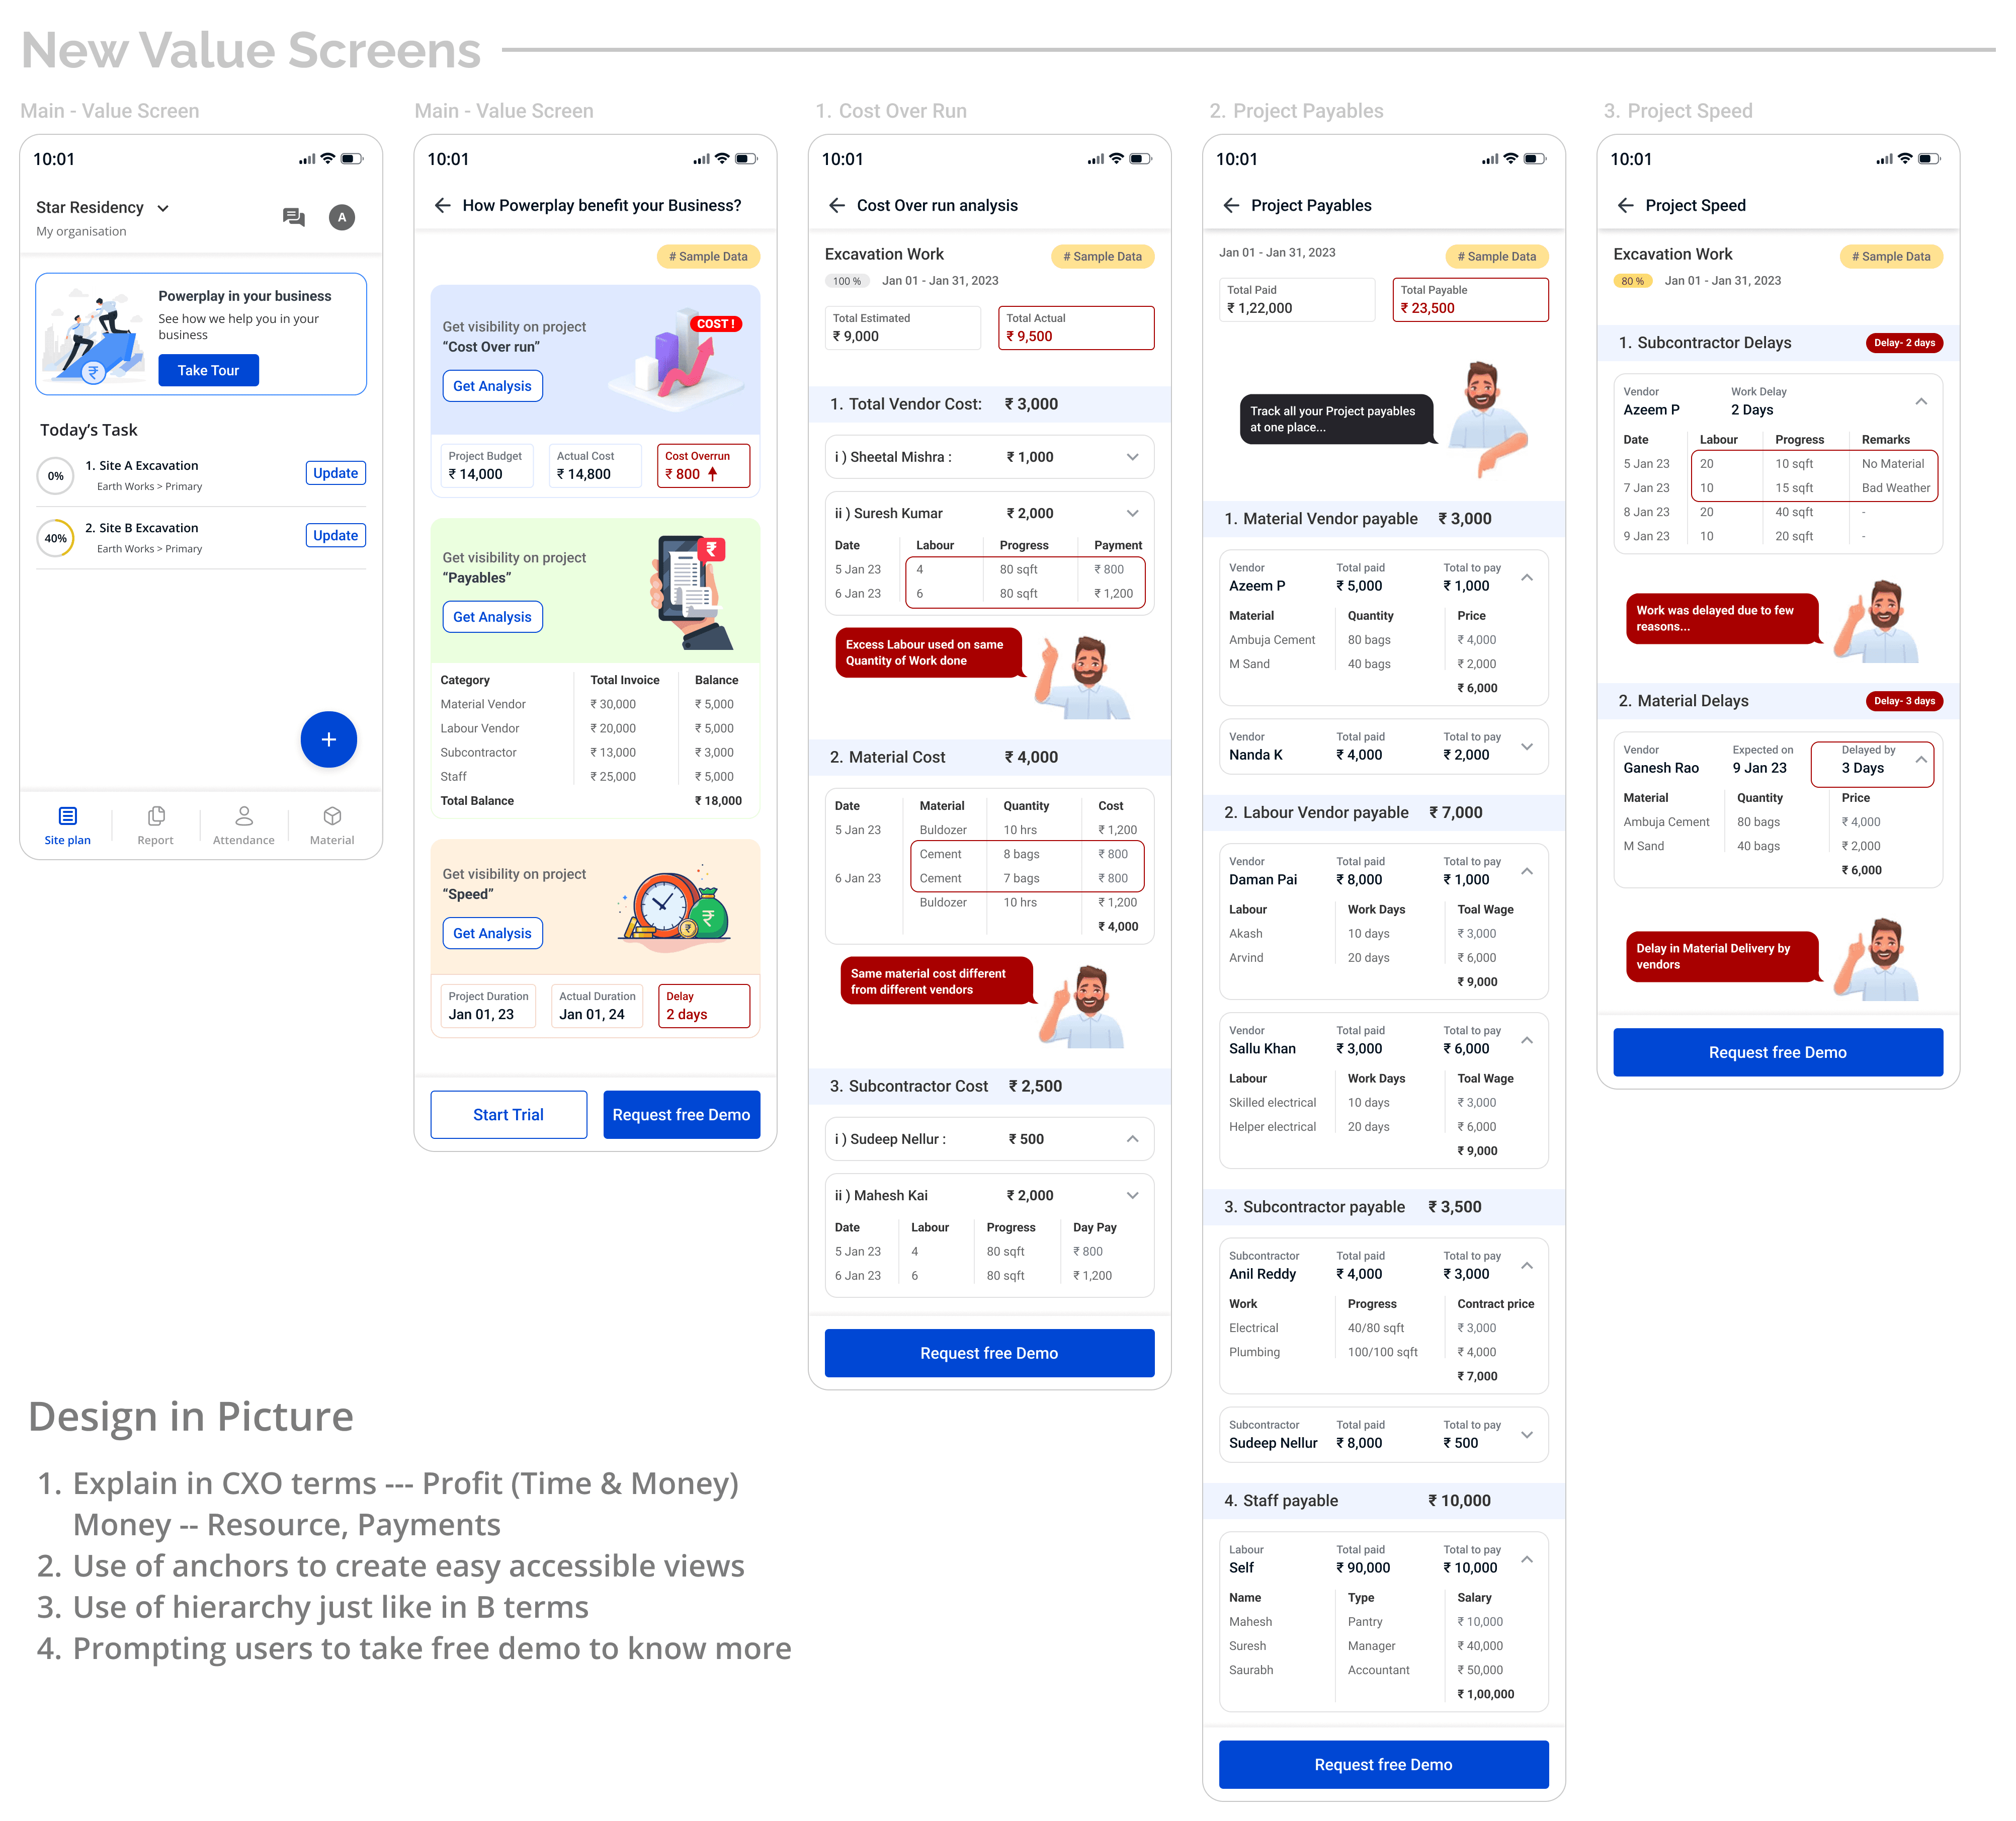
Based on the Founder Calling Insights we Bucketed all the user problems into 3 different values
Cost overruns (SC payable, Material Vendor Payable, Machinery Cost & labor Vendor Payable)
Visibility on Project payables (SC payable, Material Vendor Payable, Machinery Cost & labor Vendor Payable)
Project speed (Work Delay, Material Delays)
Restructuring the funnel ✨
We Restructuring the funnel by removing certain screens eliminated specific steps taken by founders during onboarding, directly impacting funnel numbers as below👇🏻
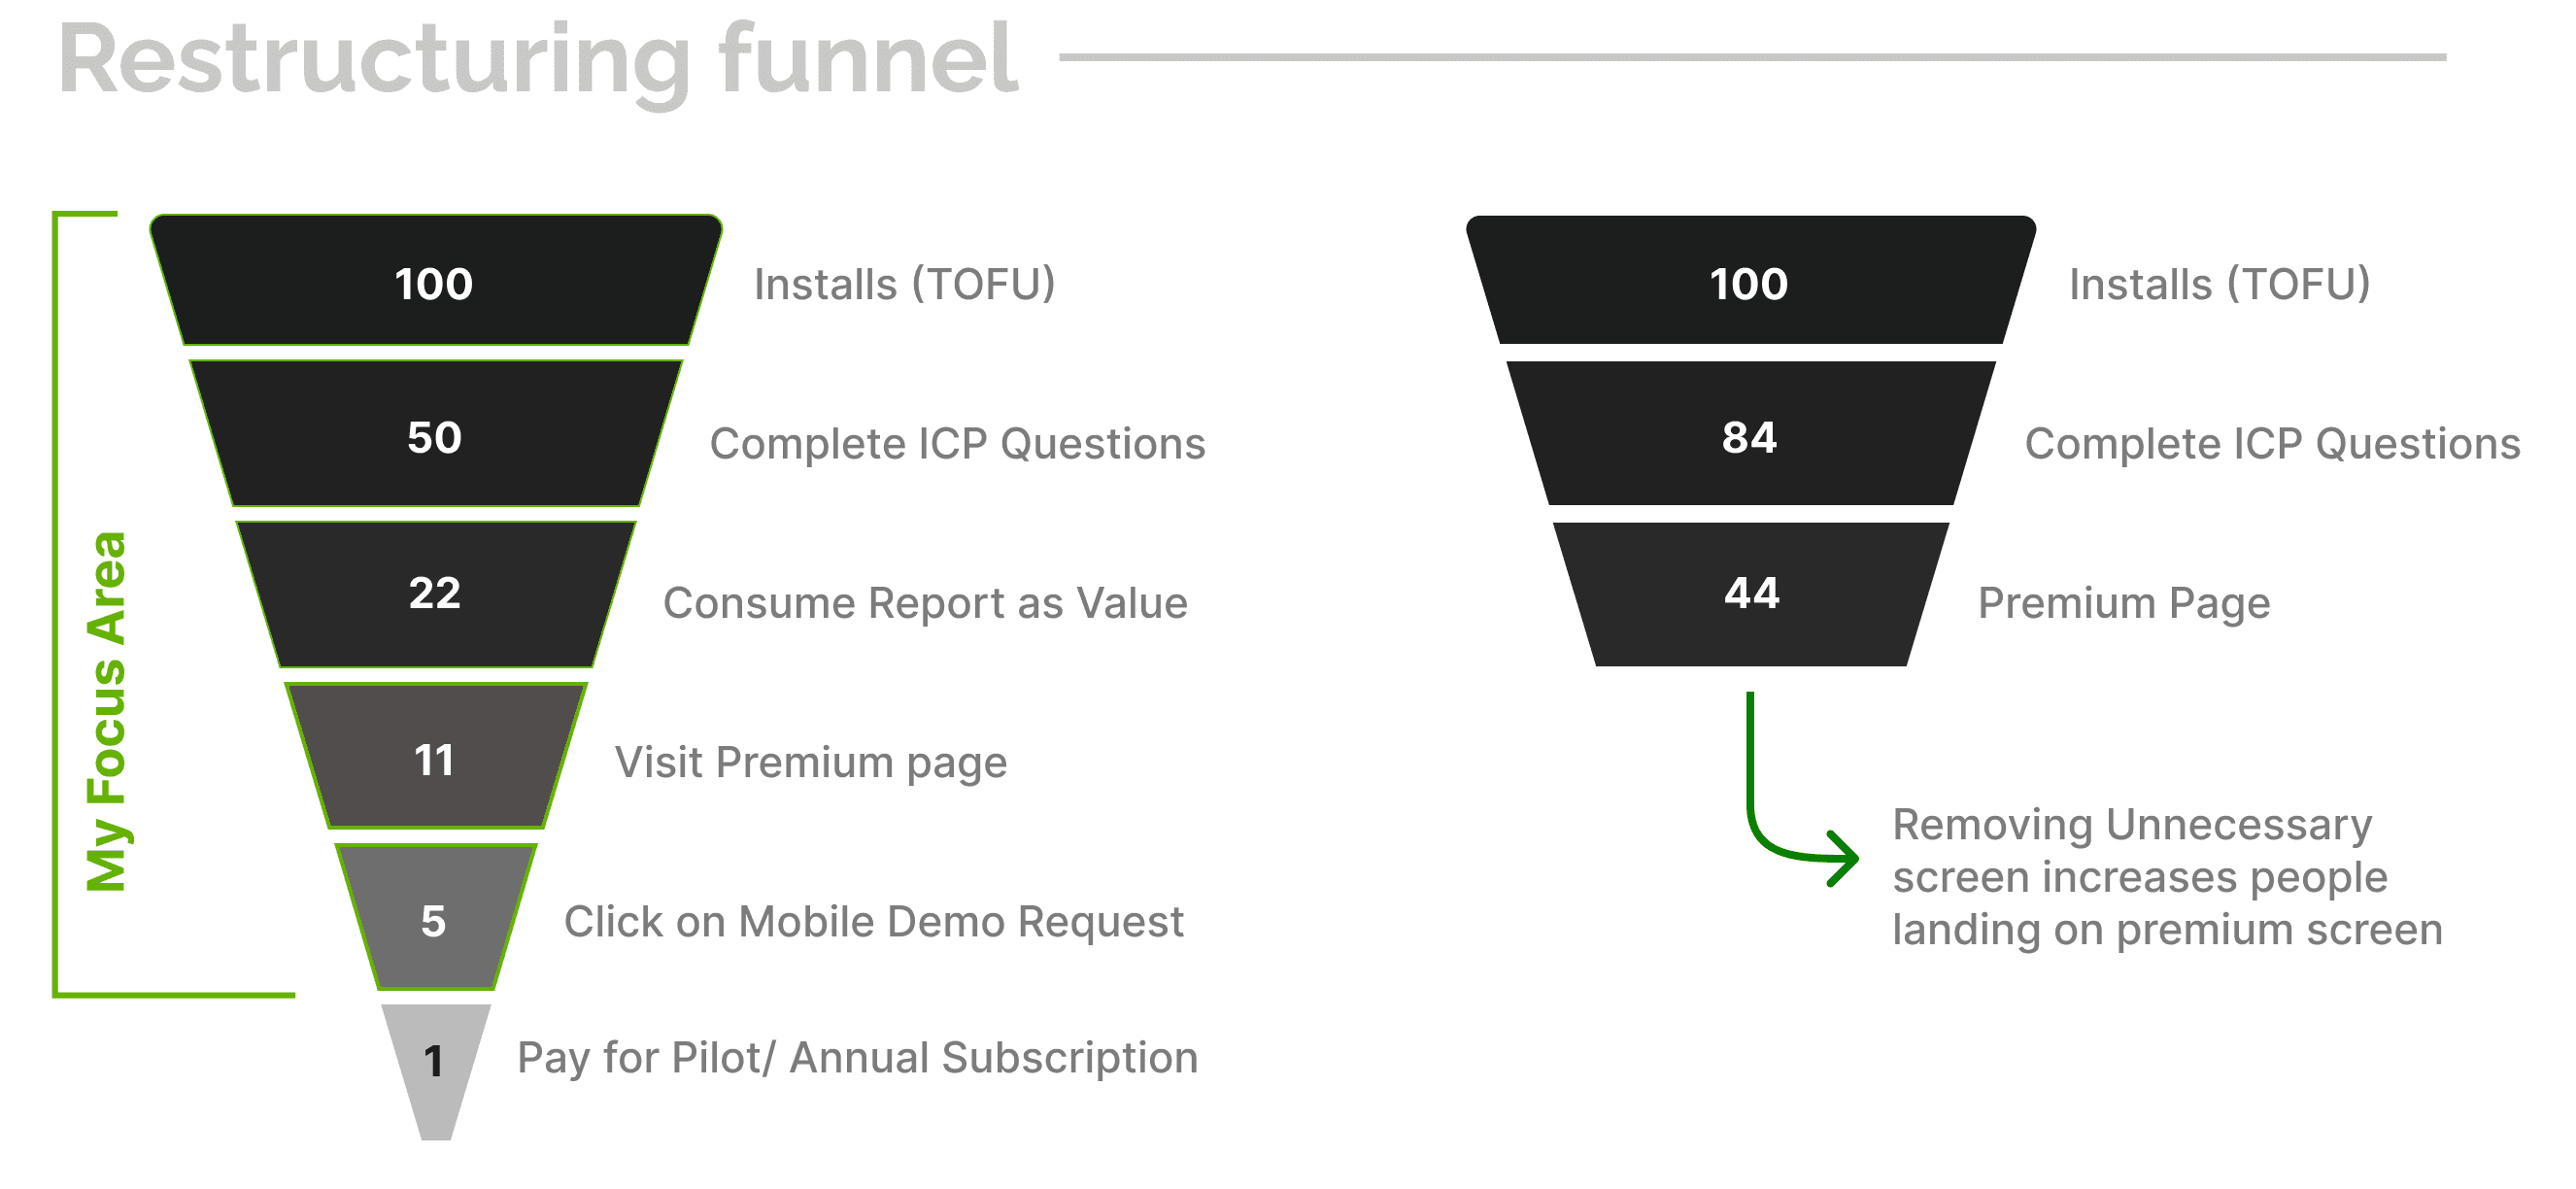
MDR Impact from EXPT 01 is 5% to 22.65% (Delta created 17.65)
EXPT 02
FAQ , Social Proofing
📈 MDR Impact from EXPT 02 is 22.65% to 32.57% (Delta created 9.92)
What did we focus on
How can we Answer all product-related queries? like- Paid/ Free | Support | Role & Permission | User Base | Data Security | Devices | Process post purchase & more
How can we make Users feel confident about the purchase they are going to make
How to convey users that, they are paying the Best price for the service they are receiving?
New Blocks in Value Screen & Payment Flow ✨
Initially, we spoke with the business team about our designs to discuss pricing models, and weighing options between Pro and Pro Plus.
Ultimately, we decided to prioritise delivering value to users to enhance our goal of increasing click-through rates for MDR and then focus on getting Product lead Payments
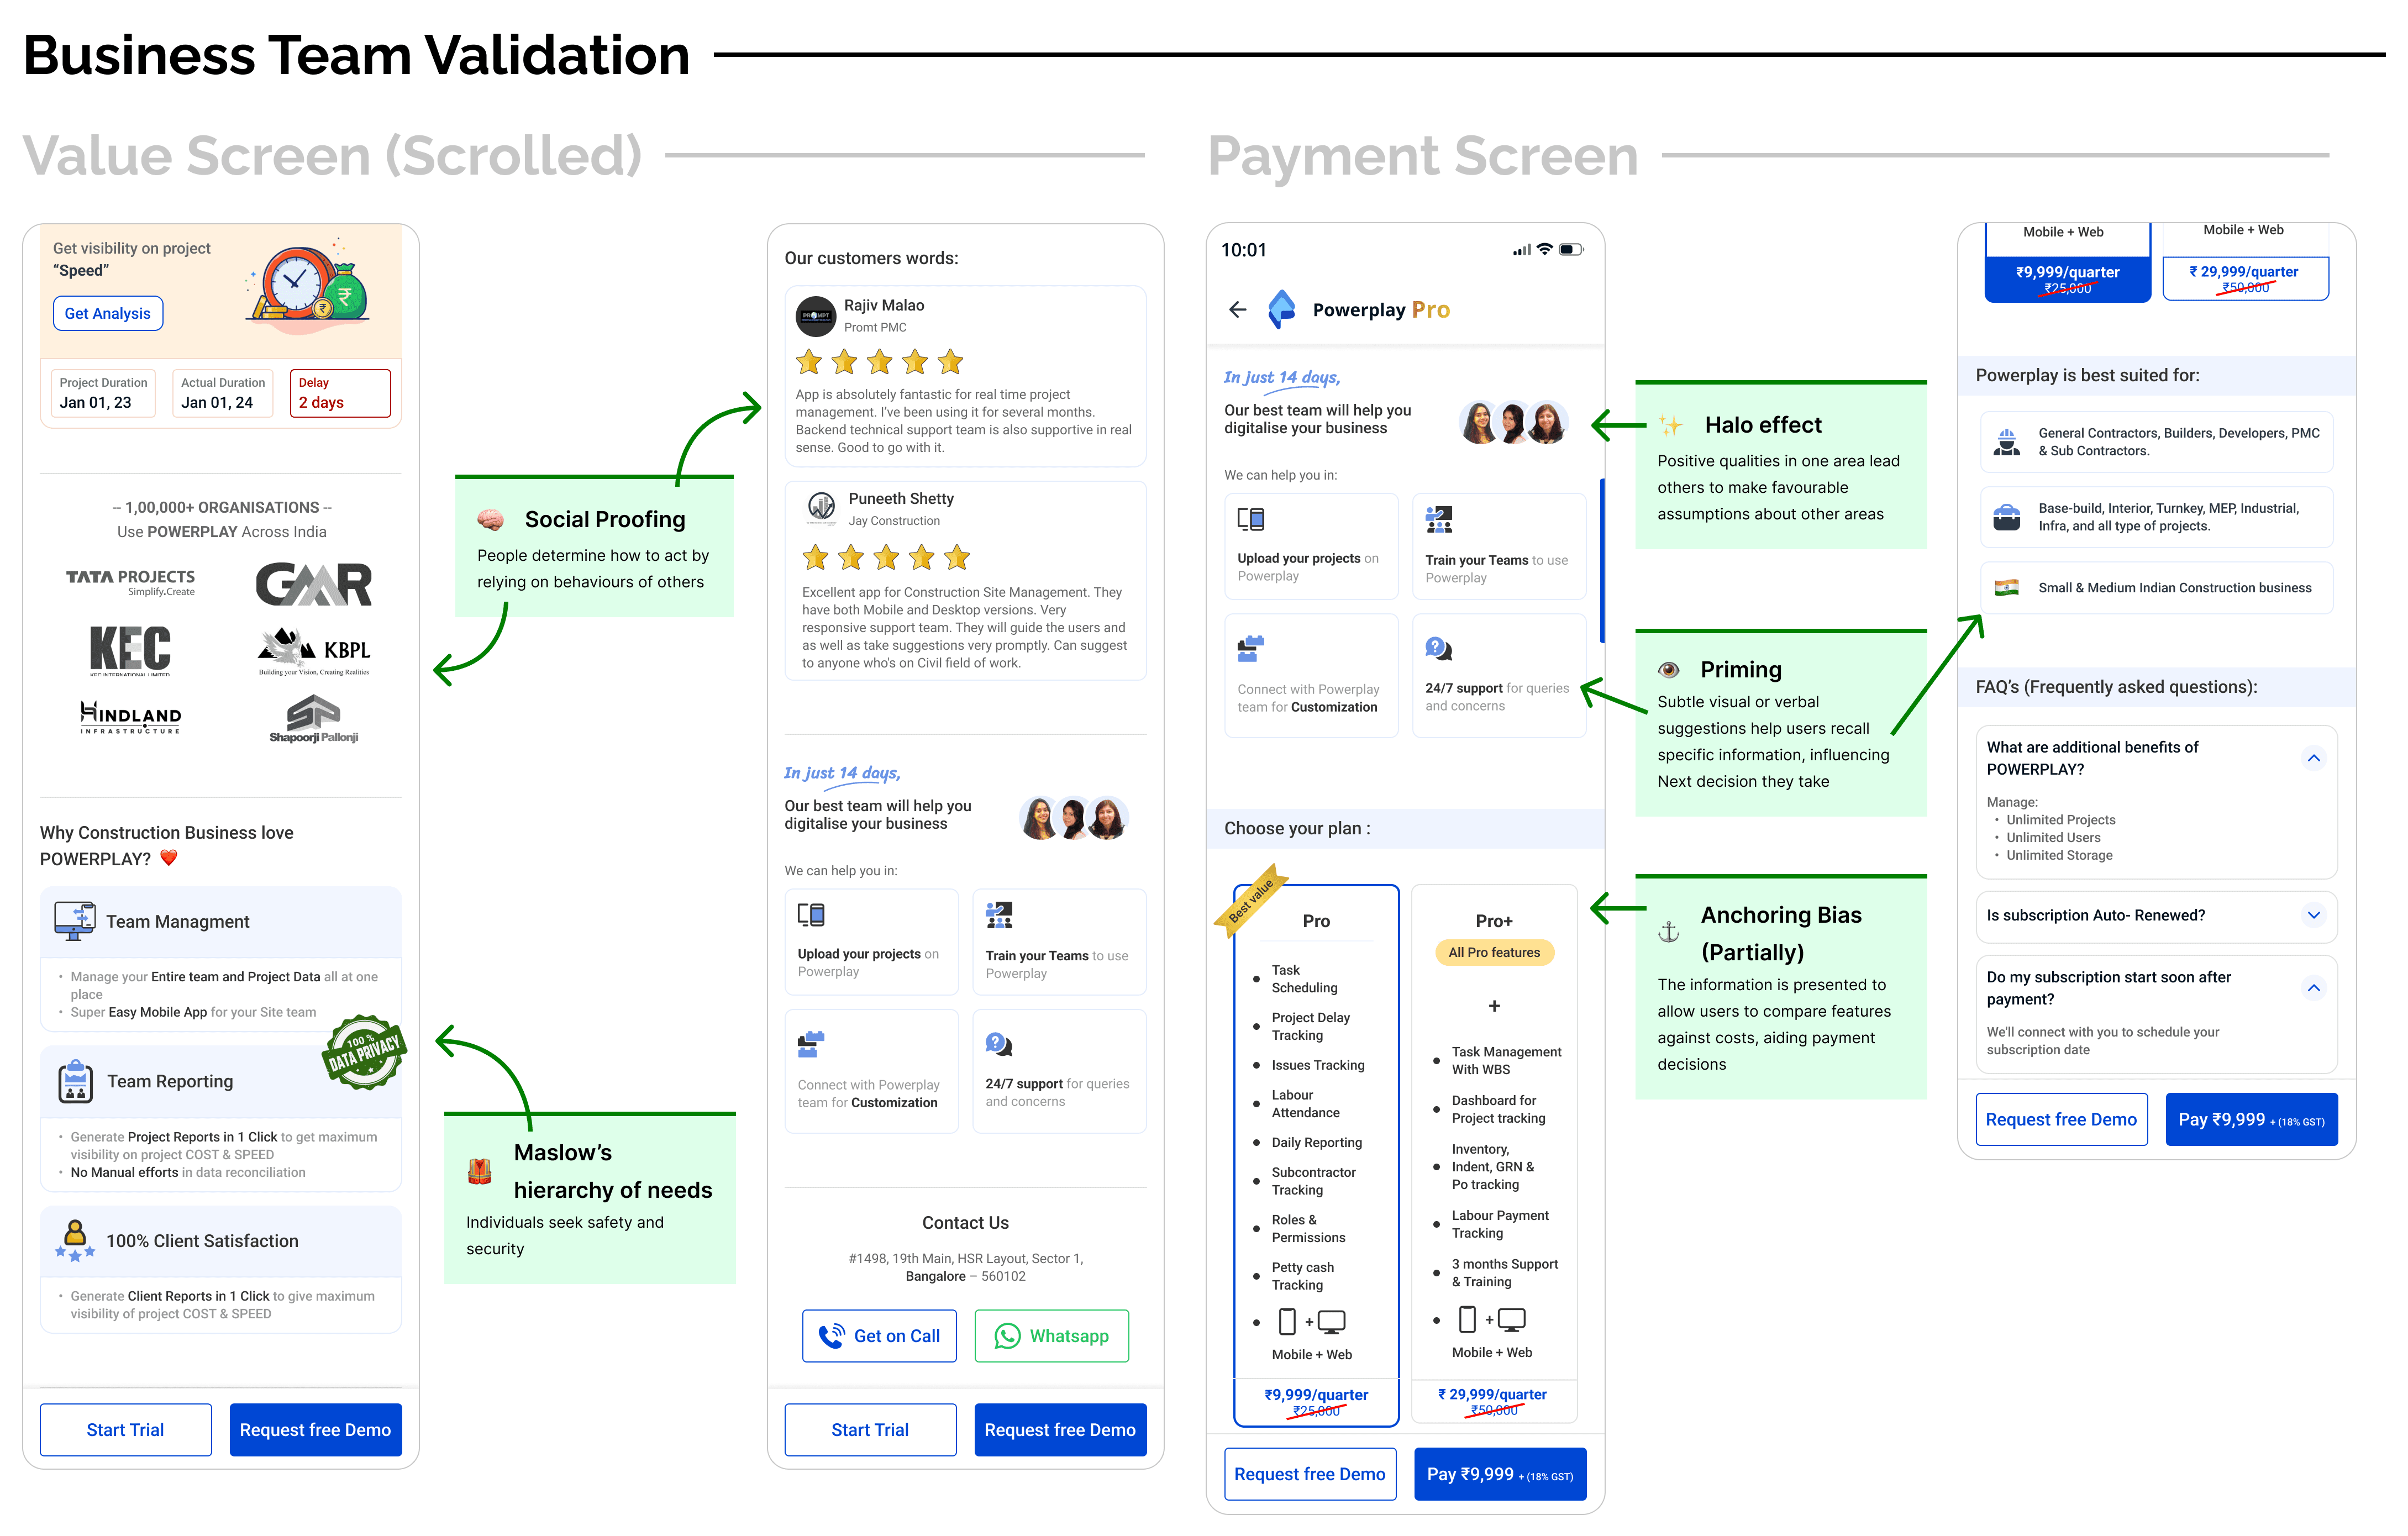
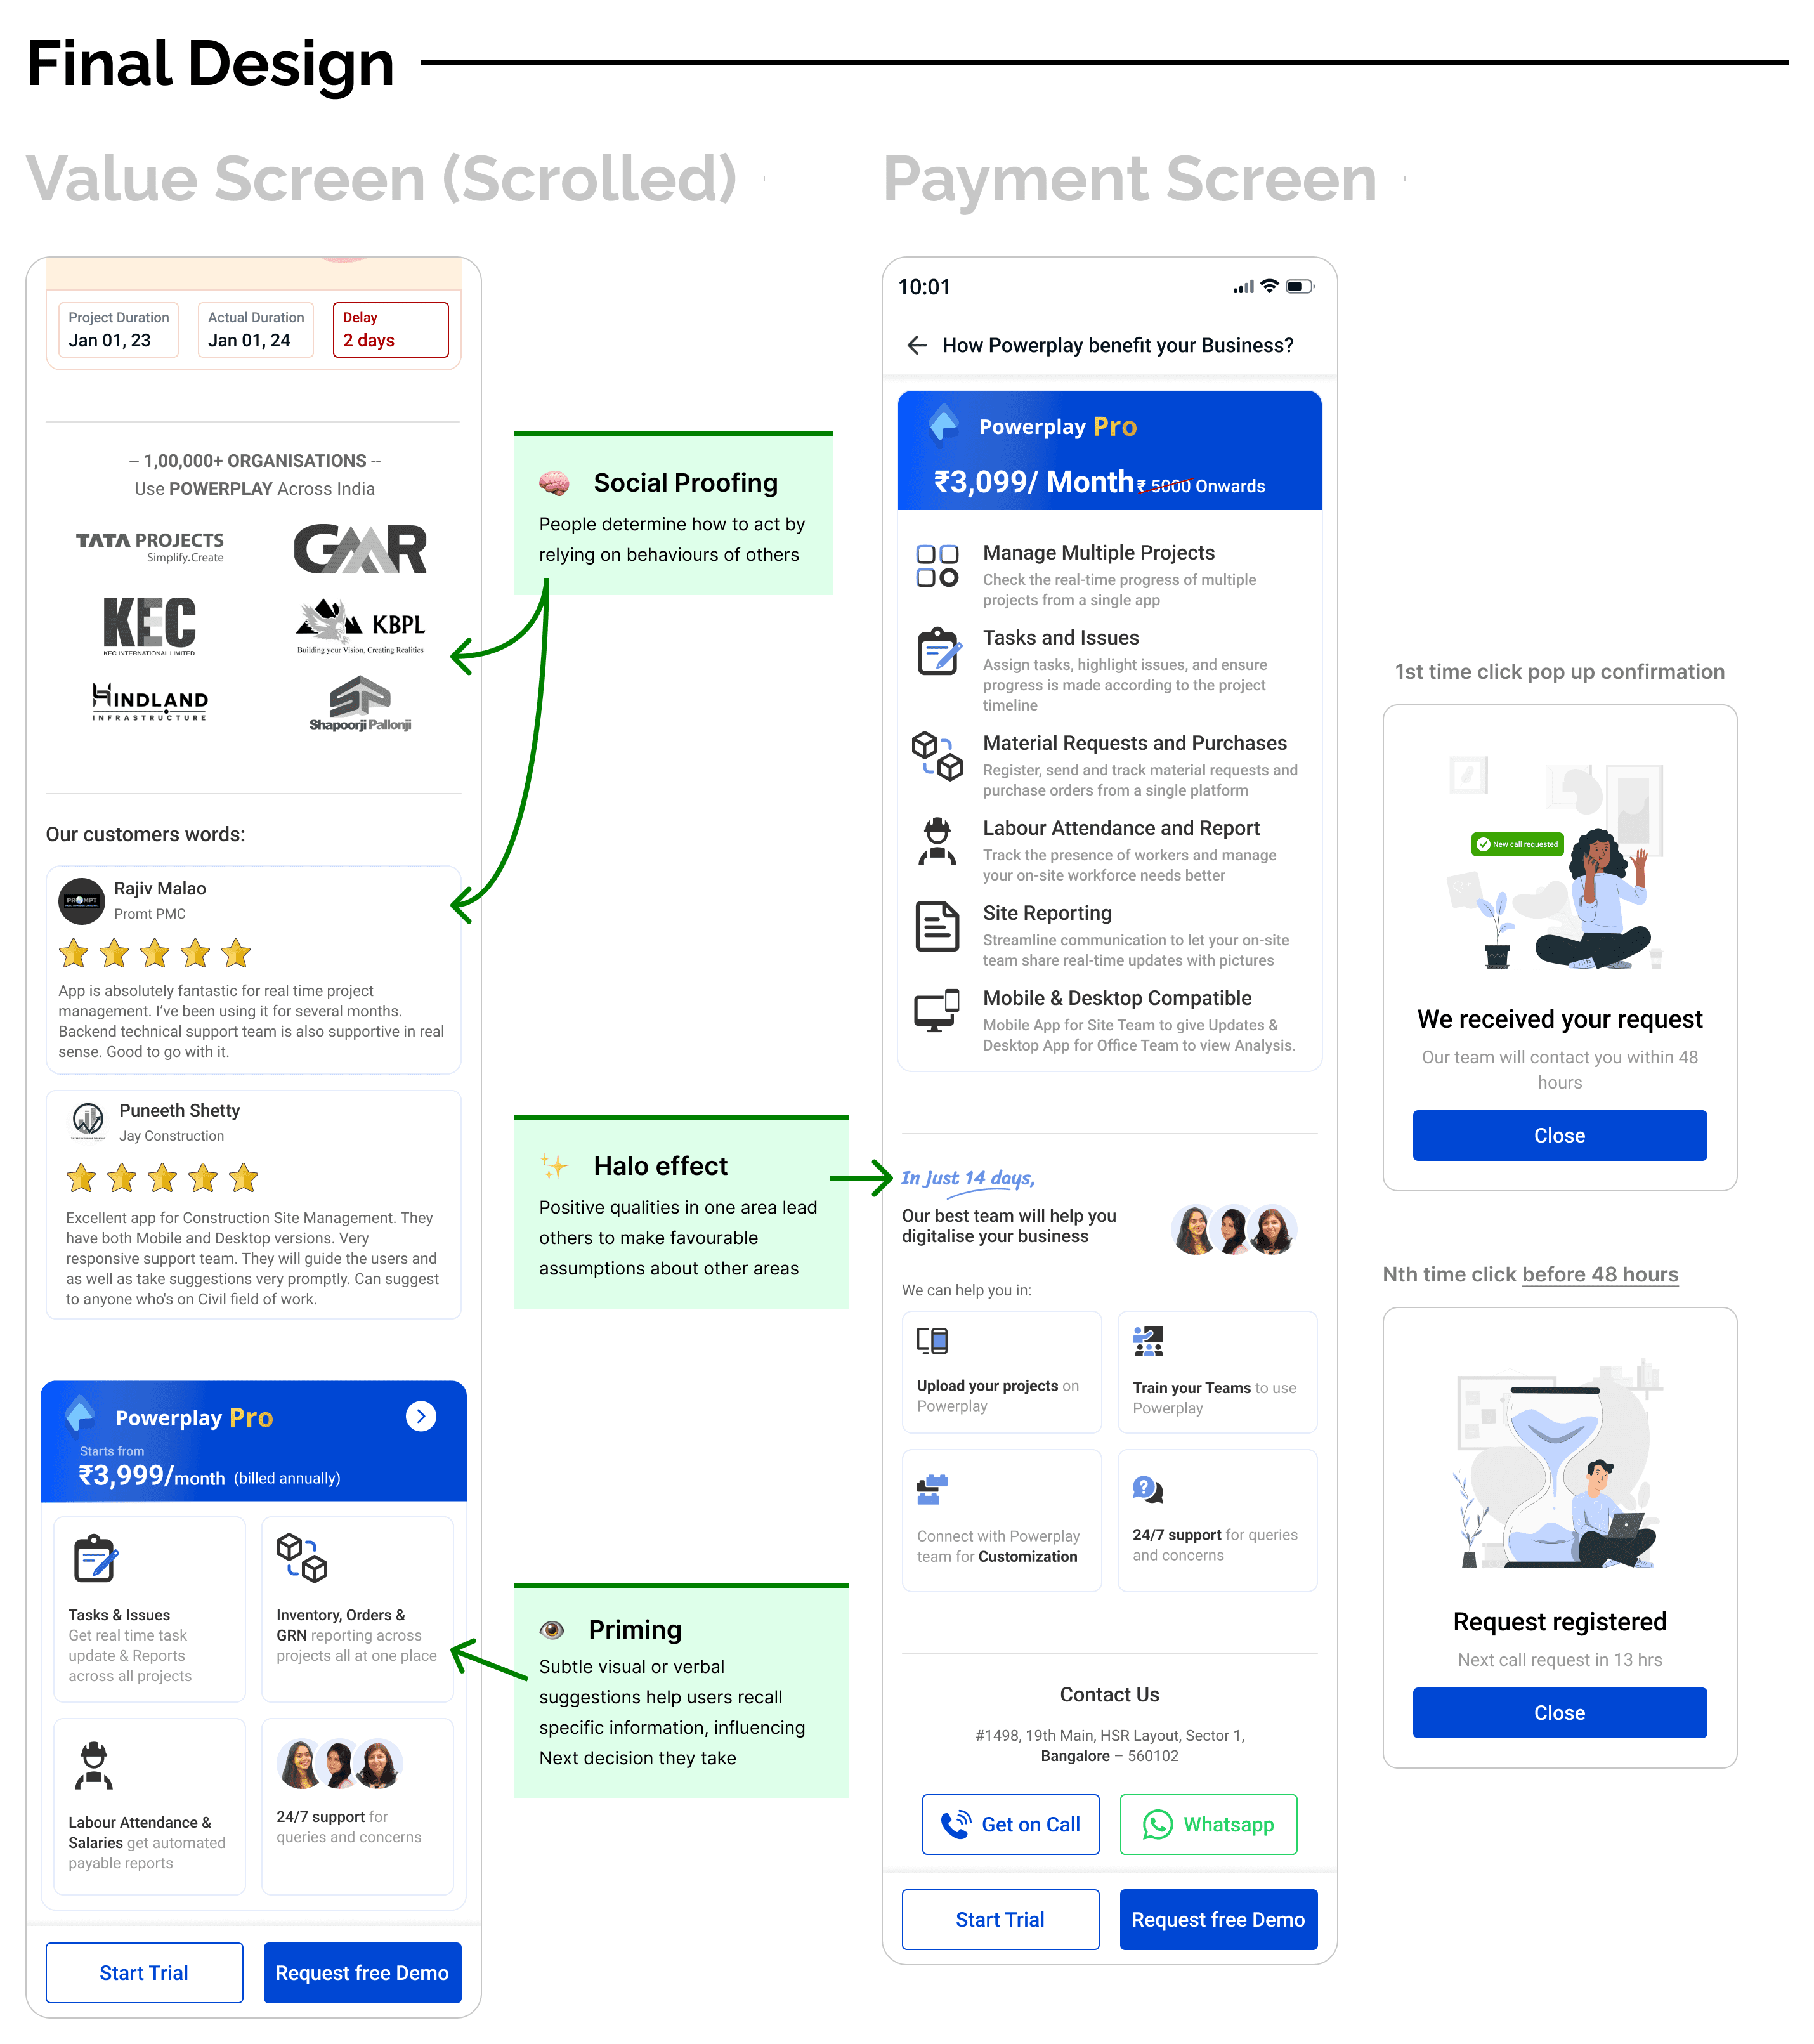
In this solution, we've consolidated to one pricing module: Powerplay Pro. Users interested in more features can click on Demo request (MDR), while our sales team is on hand always present to personalised upselling.
📈 MDR Impact from EXPT 02 is 22.65% to 32.57% (Delta created 9.92)
EXPT 03
Increasing Payment screen discoverability & Help Section
📈 MDR Impact from EXPT 02 is 32.57% to 39.88% (Delta created 7.31)
What did we focus on
How to increase the Discoverability of our payment screens from other modules
How did we start Conveying benefits via Video.
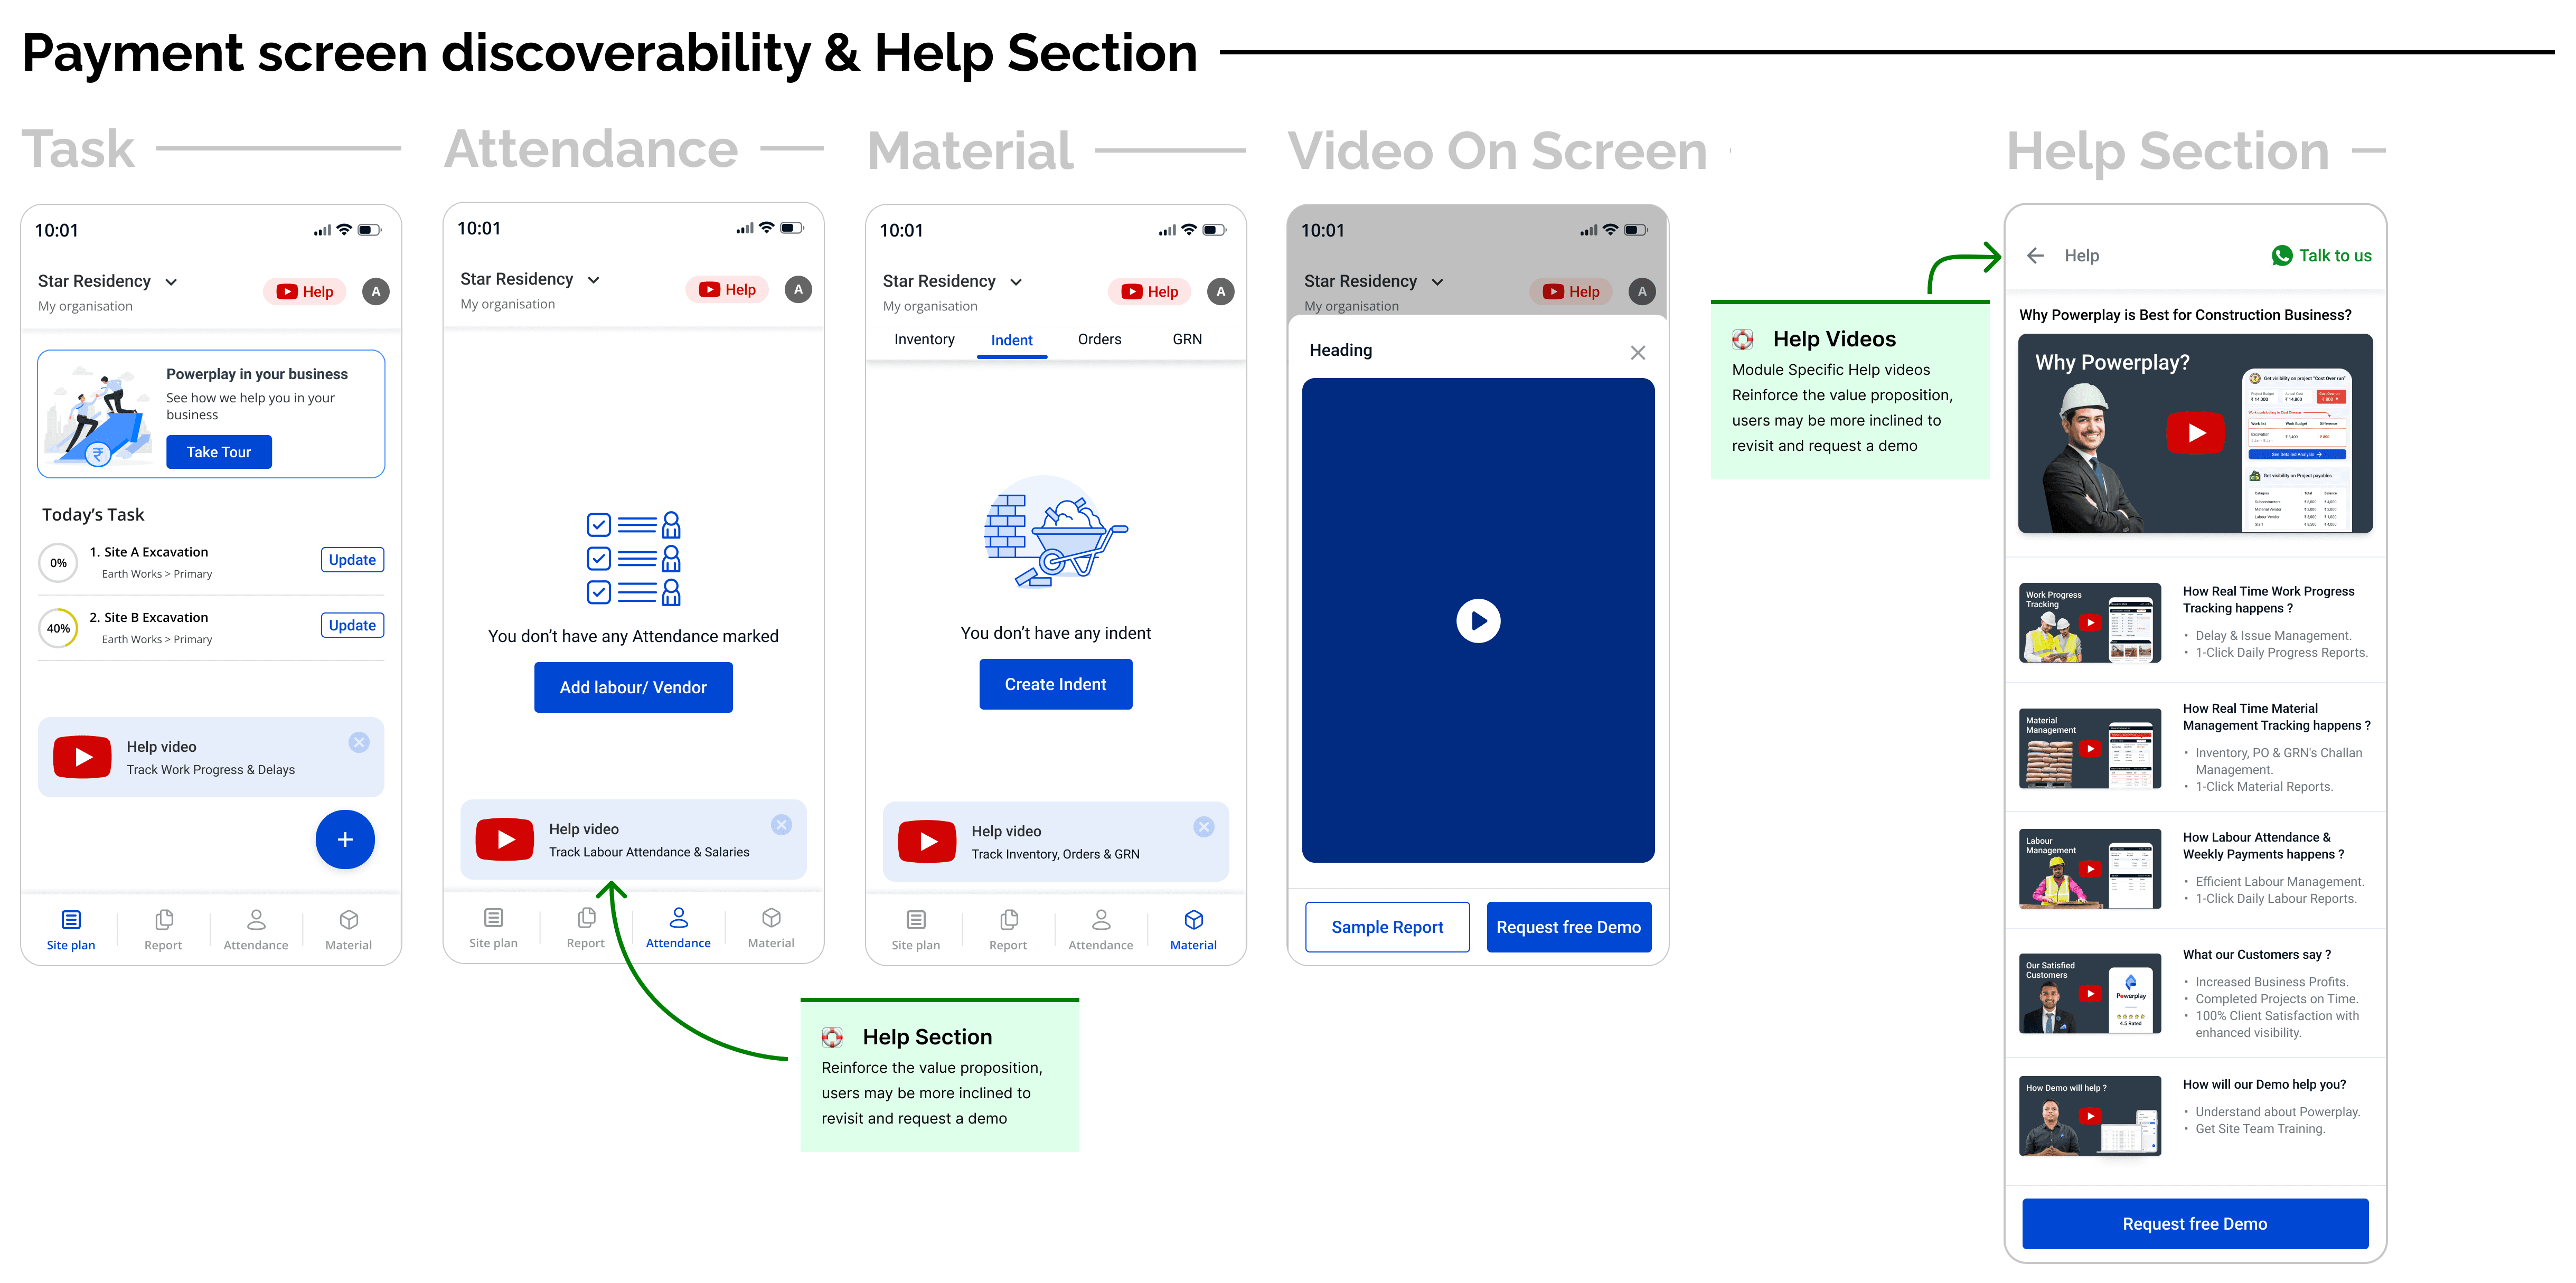
We implemented problem-specific solutions tailored to each user's module, incorporating helpful videos. This approach not only encouraged users to explore further by clicking on Demo requests but also facilitated easy access to all problem-specific videos through a centralised repository.
📈 MDR Impact from EXPT 02 is 32.57% to 39.88% (Delta created 7.31)
EXPT 04
Notification Setup (Designer Not Involved)
⚡ Note: The PM (Gagan BT) solely conducted This Experiment was solely conducted by My PM (Gagan BT) after we conducted three prior experiments. All additional credits regarding delta in MDR go to him.
📈 MDR Impact from EXPT 04 is 39.88% to 44.98% (Delta created 5.1)
What did he (PM) focus on
To Nurture dropped founders after initial usage and highlight product benefits, we plan to nurture them through WhatsApp videos.
📈 MDR Impact from EXPT 04 is 39.88% to 44.98% (Delta created 5.1)
Overall Impact
⚡️ Note: All experiments were conducted sequentially, released in phases due to tech bandwidth constraints. The overall impact was collaboratively assessed.
Overall MDR Impact 5% to 44.98% (Delta created 39.98)

Experiment Impact Split
📈 EXPT 01- MDR Impact 5% to 22.65% (Delta created 17.65)
📈 EXPT 02- MDR Impact 22.65% to 32.57% (Delta created 9.92)
📈 EXPT 03- MDR Impact 32.57% to 39.88% (Delta created 7.31)
📈 EXPT 04- MDR Impact 39.88% to 44.98% (Delta created 5.1)
⚡ Note: Last experiment was solely conducted by My PM (Gagan BT) after we conducted three prior experiments. All additional credits regarding delta in MDR go to him.
Data proving Projects consistency over the past year, with ongoing operations.
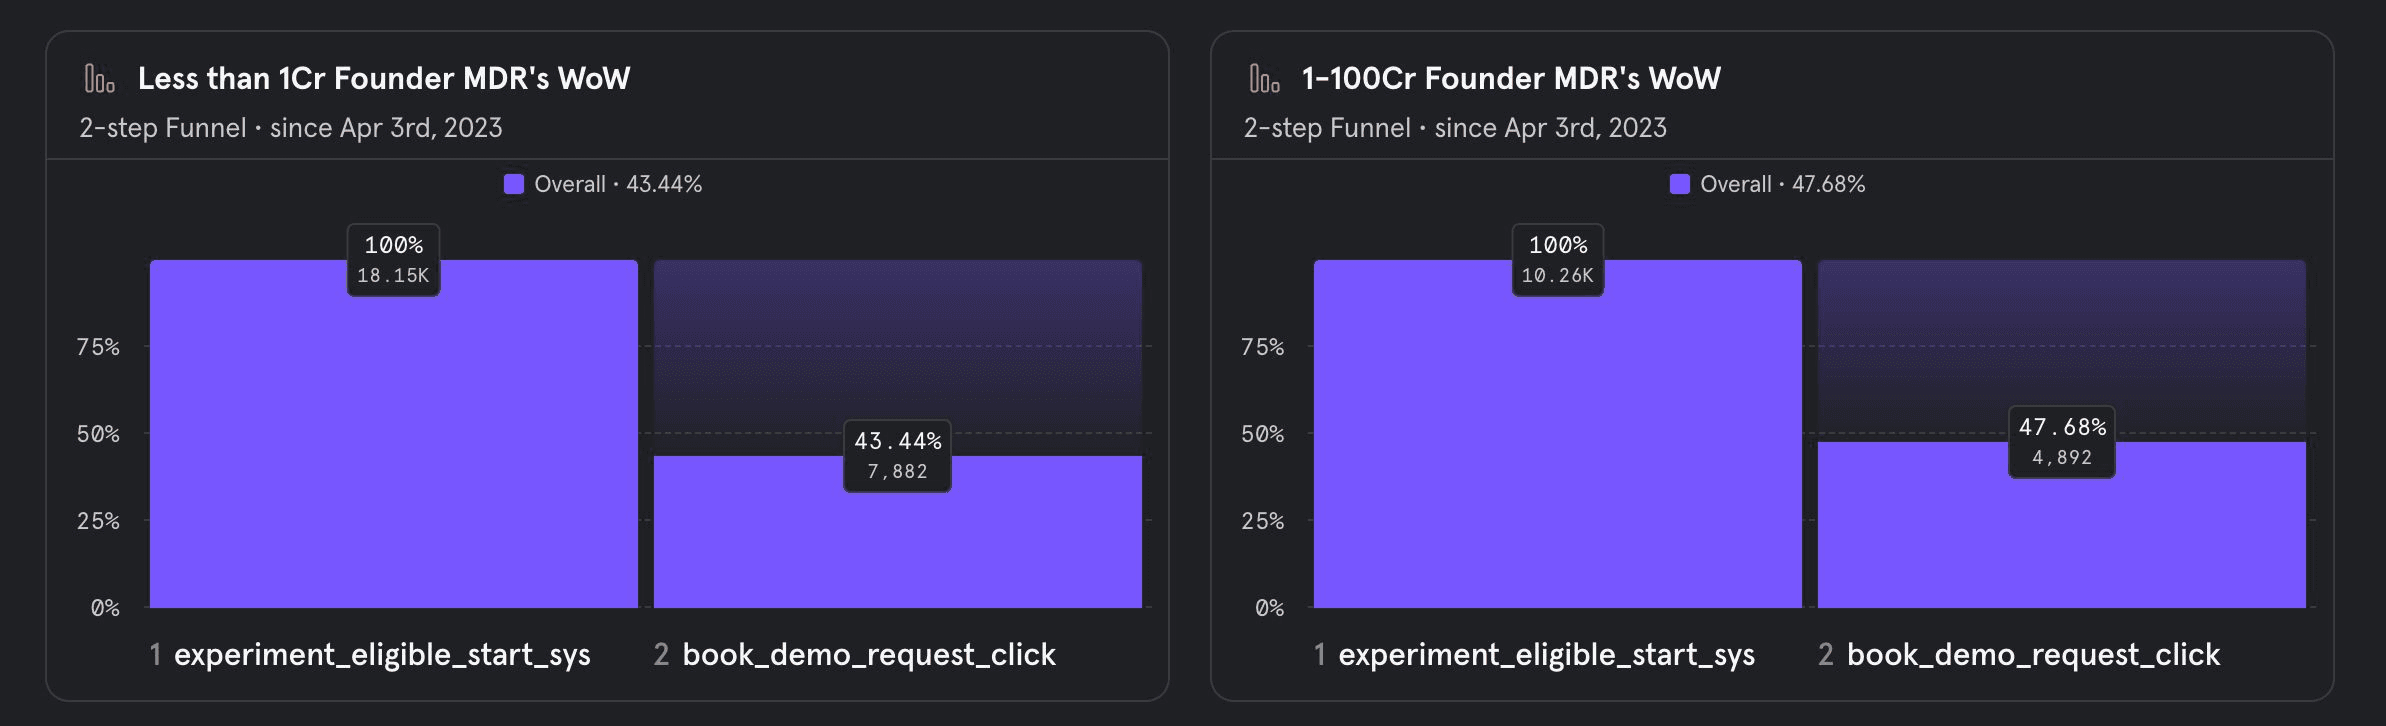
MDR Founder’s Split
Whatsapp Campaign results

