
Designing an AI-assisted pricing system to improve EV charging station revenue
⚡ Overview
Electric vehicle (EV) charging is growing fast—but profitability isn’t.
At ChargePoint, we identified that many station owners struggled to maximise revenue due to static pricing and high operational complexity.
I worked on designing an AI-powered pricing recommendation system to help operators make smarter, data-driven pricing decisions.
EV Industry context
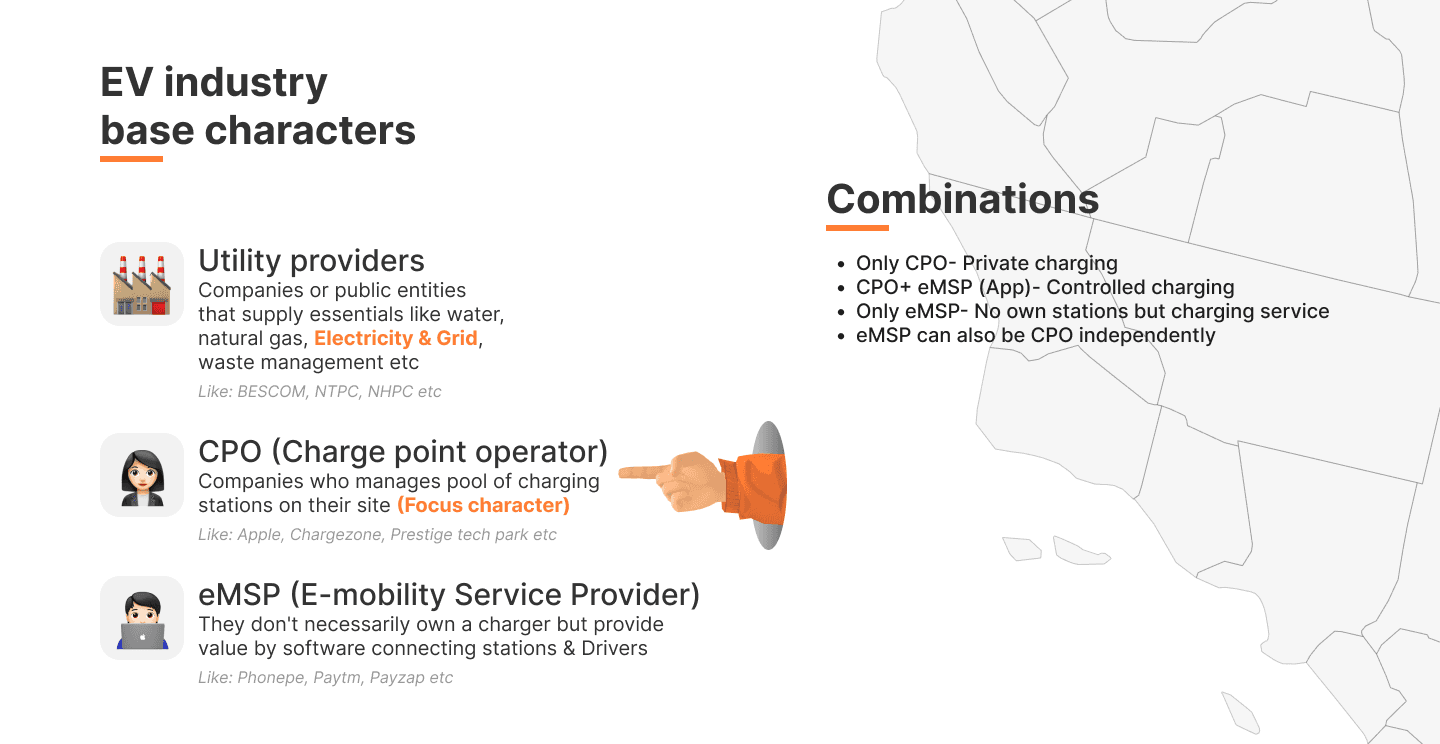
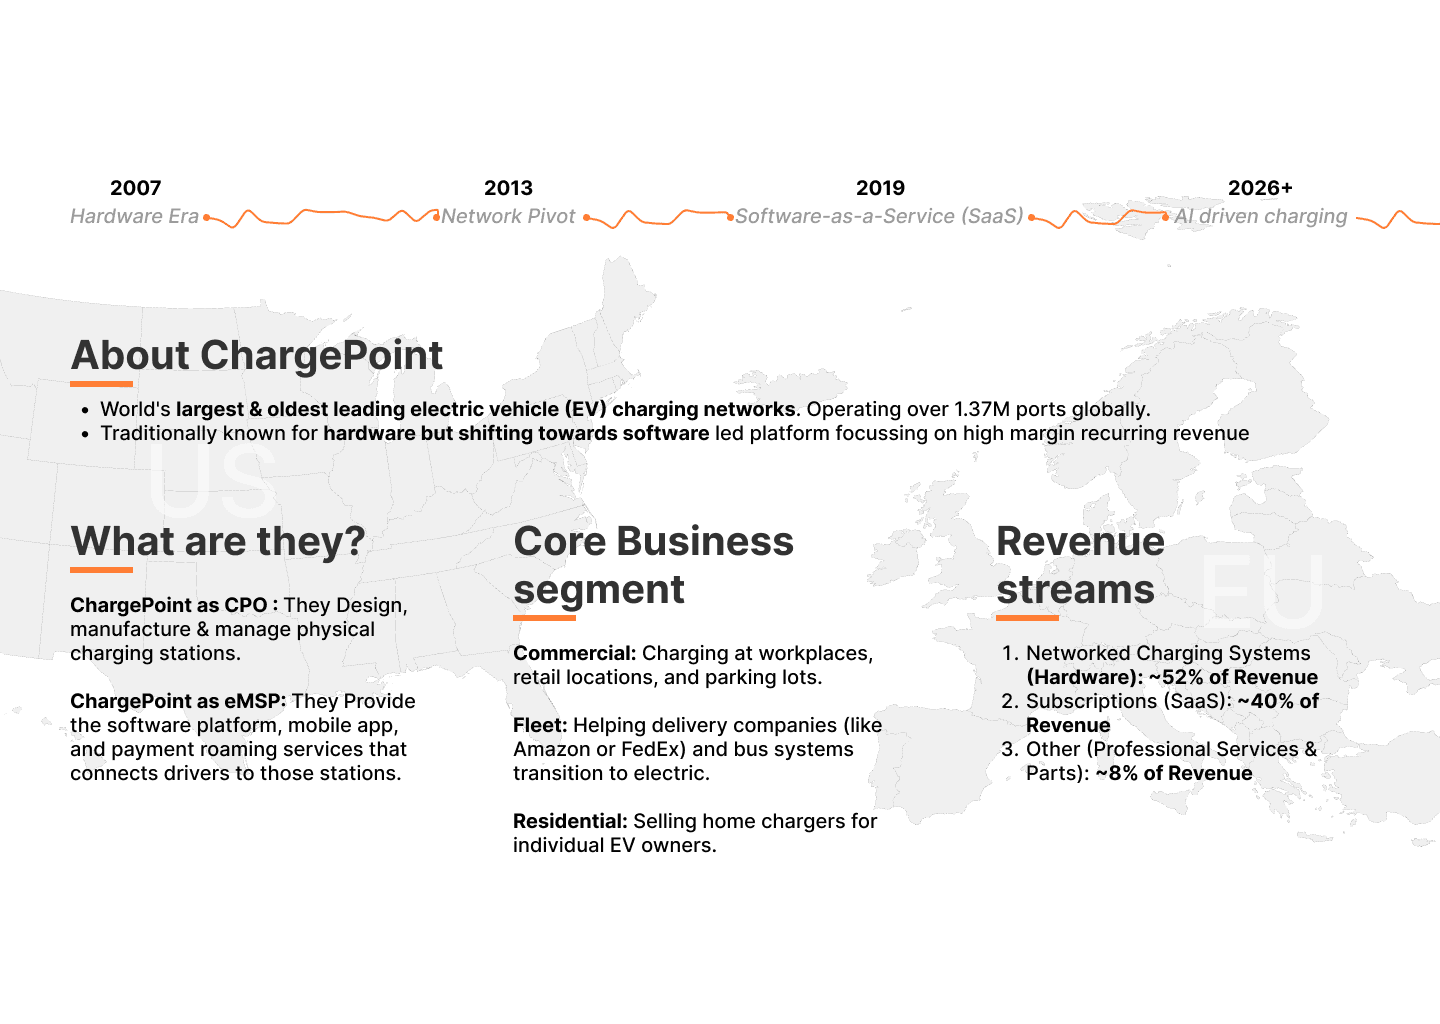
About ChargePoint
Business Problem
Despite massive EV growth, Most charging stations are underperforming financially & are not profitable for Station owners
Why?
Coz station pricing is:
Static (one-size-fits-all approach)
Manual
Based on limited inputs
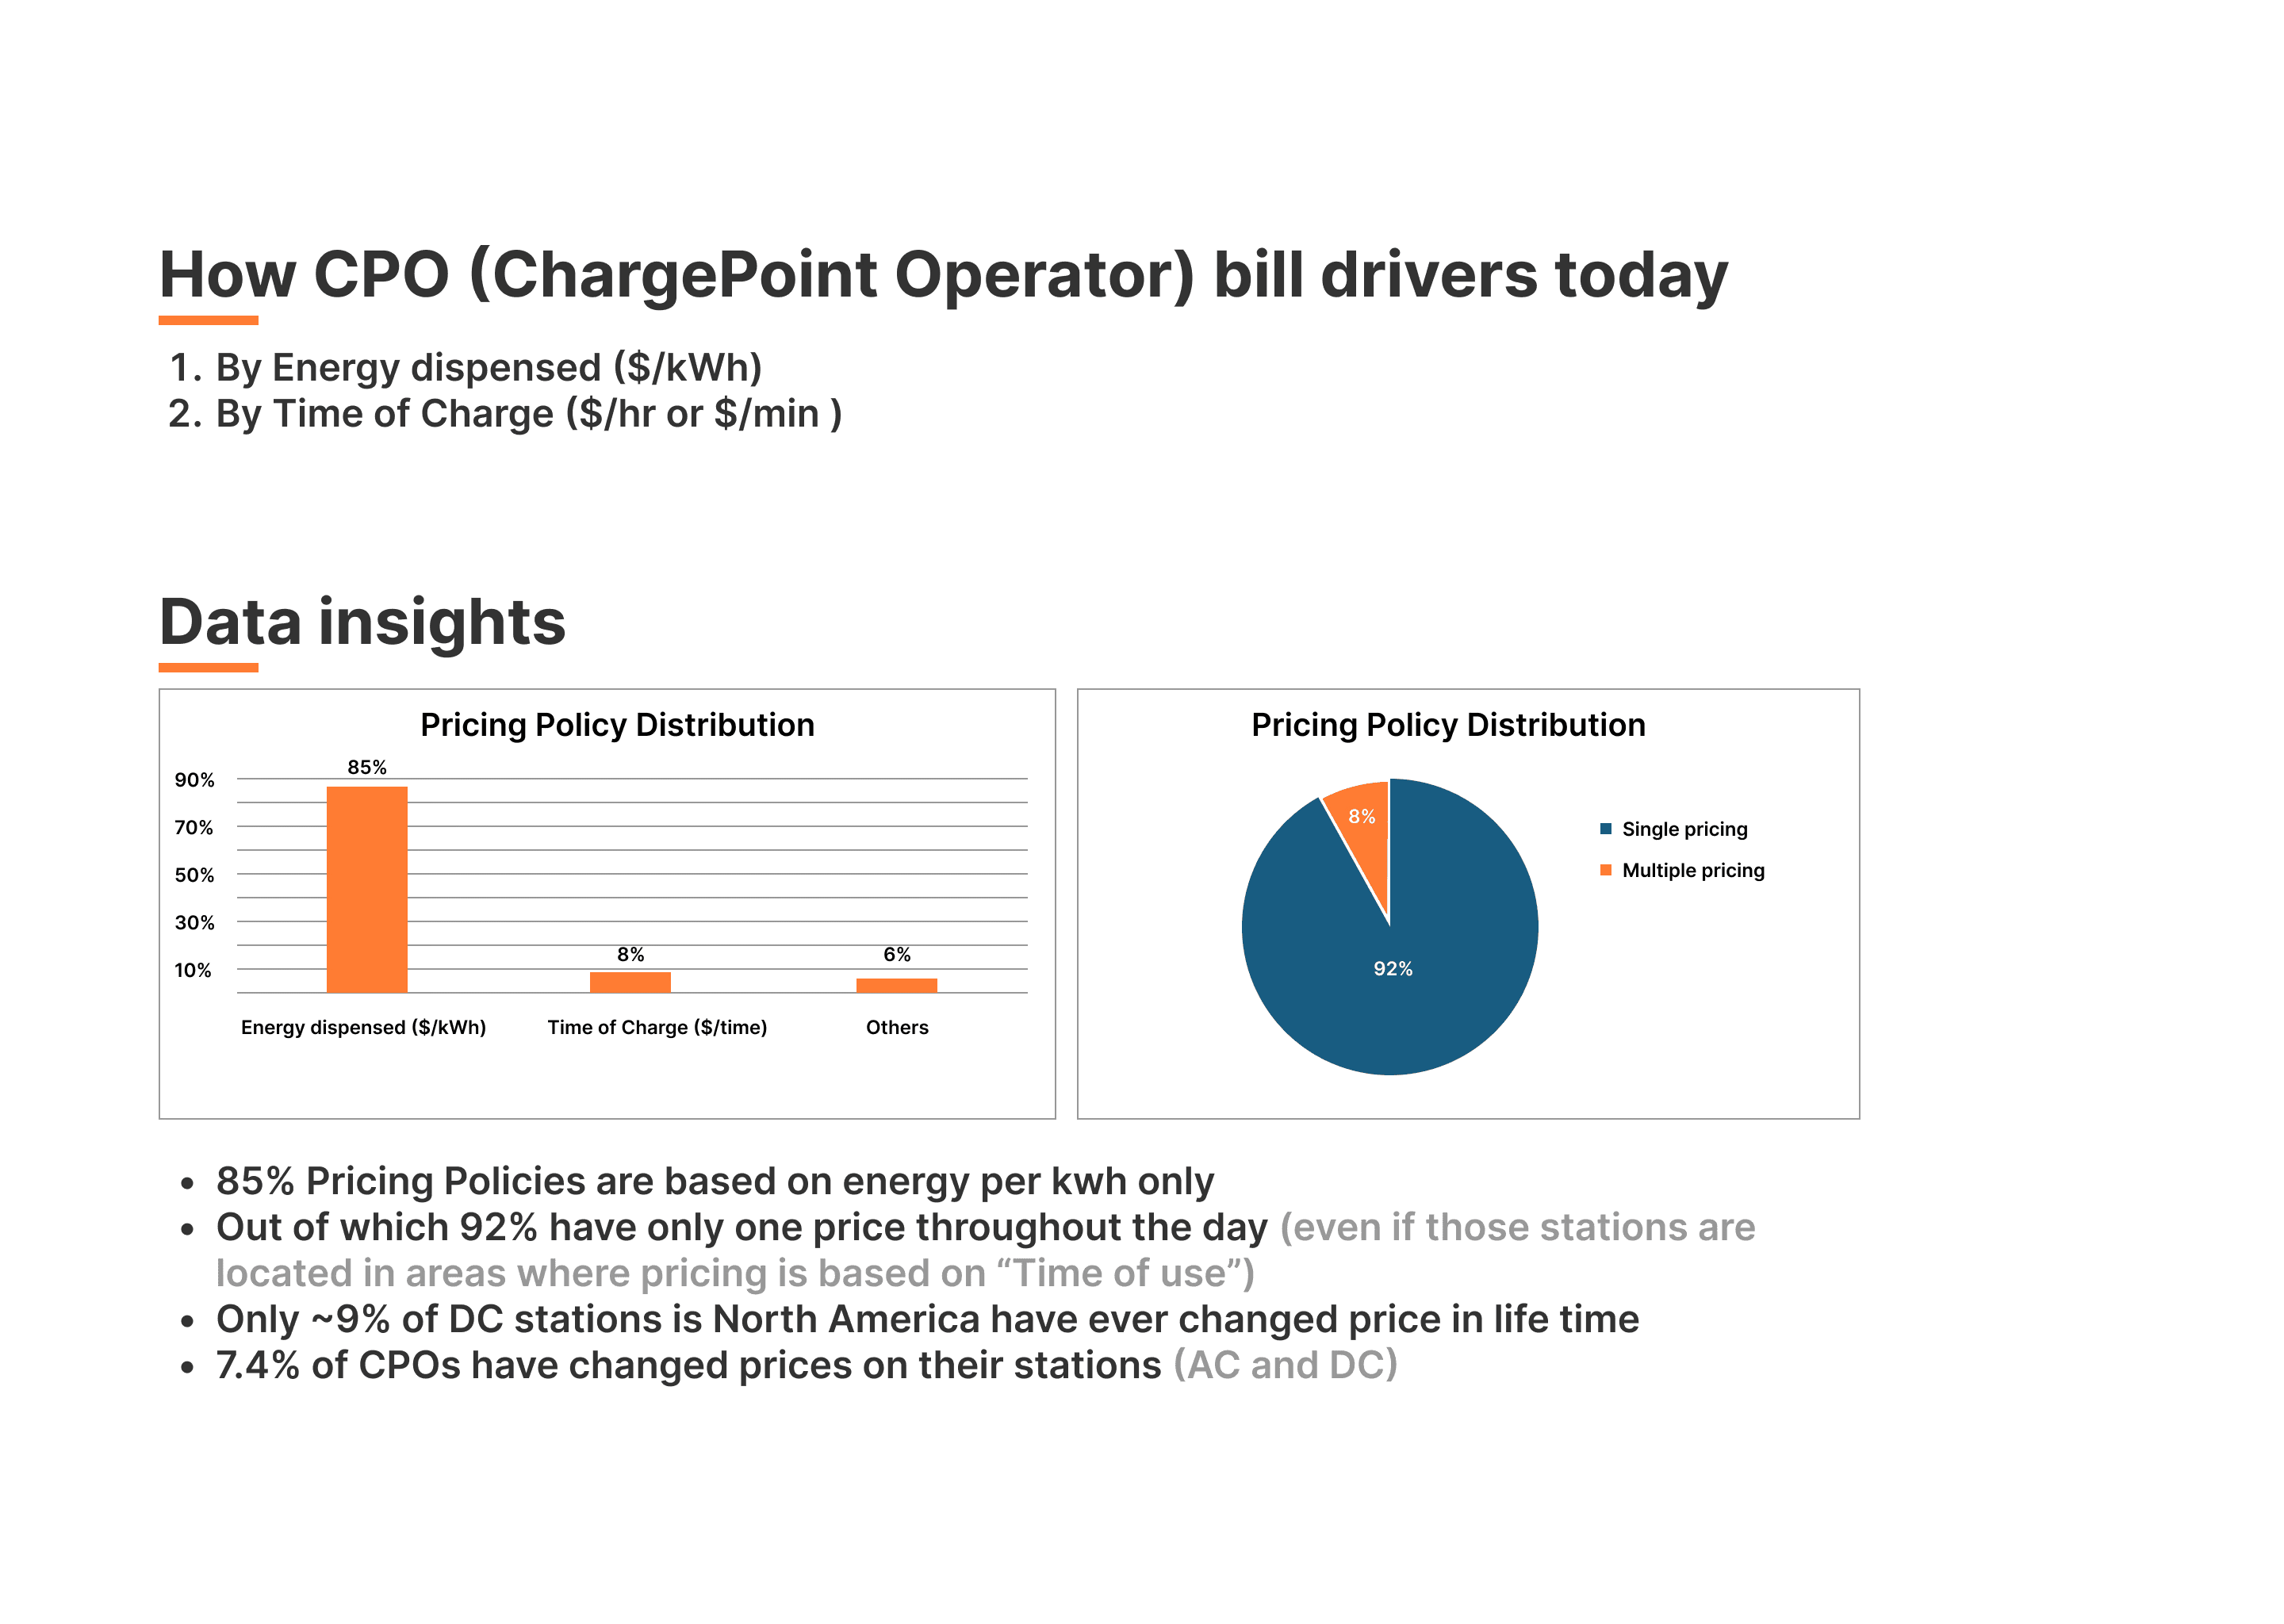
Data insights
85% use flat $/kWh pricing
92% never change pricing during the day
Only 7.4% of operators actively update prices
Problems in detail
Set pricing based on few inputs (Demand trends)
Public stations sit ideal at slow hours, get slammed at peak hours, and pay punishing demand charges
Don’t have time & skills to monitor pricing based on competition
Fear losing customers if prices increase
Personas
Not all charging stations operate with the same goals.
To design an effective pricing system, we first mapped different types of station owners (CPOs) based on their business models.
Persona Type | Description | Company name | Reference in India | Charging Context | Primary Goals | Charger Type | Pricing Sensitivity |
|---|---|---|---|---|---|---|---|
🚛 Fleet Operators “Keep vehicles moving” |
| Gillig, UPS (EU) | KSRTC Electric Bus depot, Uber depot | Vehicles have dedicated place (Depot) or daily charging |
| Both AC and DC stations | 🟢 Low |
🛍️ Amenities Extenders “Bring customers in” |
| Startbucks, Local restro, Big box stores | Metro, Dmart, CCD, MCD etc |
|
| Mostly AC chargers | 🟢 Low |
🏢 Benefits Extenders “Keep employees happy” |
| Google, Apple or Meta | Prestige tech park, Google, Microsoft |
|
| Mostly AC chargers | 🟡 Medium |
⚡ Electron Sellers (CPOs) “Every kWh counts” "Our Focus" ❇️ |
| BP pluse, Tesla, Love’s, Superchargers, Walmart fuelling stations | Tata Power EZ Charge, Jio-bp, and ChargeZone |
|
| Mostly DC fast chargers | 🔴 High Core to business (OUR FOCUS AREA) |
Focussed Persona
Electron Seller (CPO)
Revenue-driven
Operates DC fast chargers
Highly sensitive to pricing strategy
Their Goal: “Every kWh should maximise profit.”
Defined Goal
Design a system to:
📈 Increase site revenue (>5%)
⚡ Improve utilisation (>25%)
🤝 Maintain trust with drivers & operators
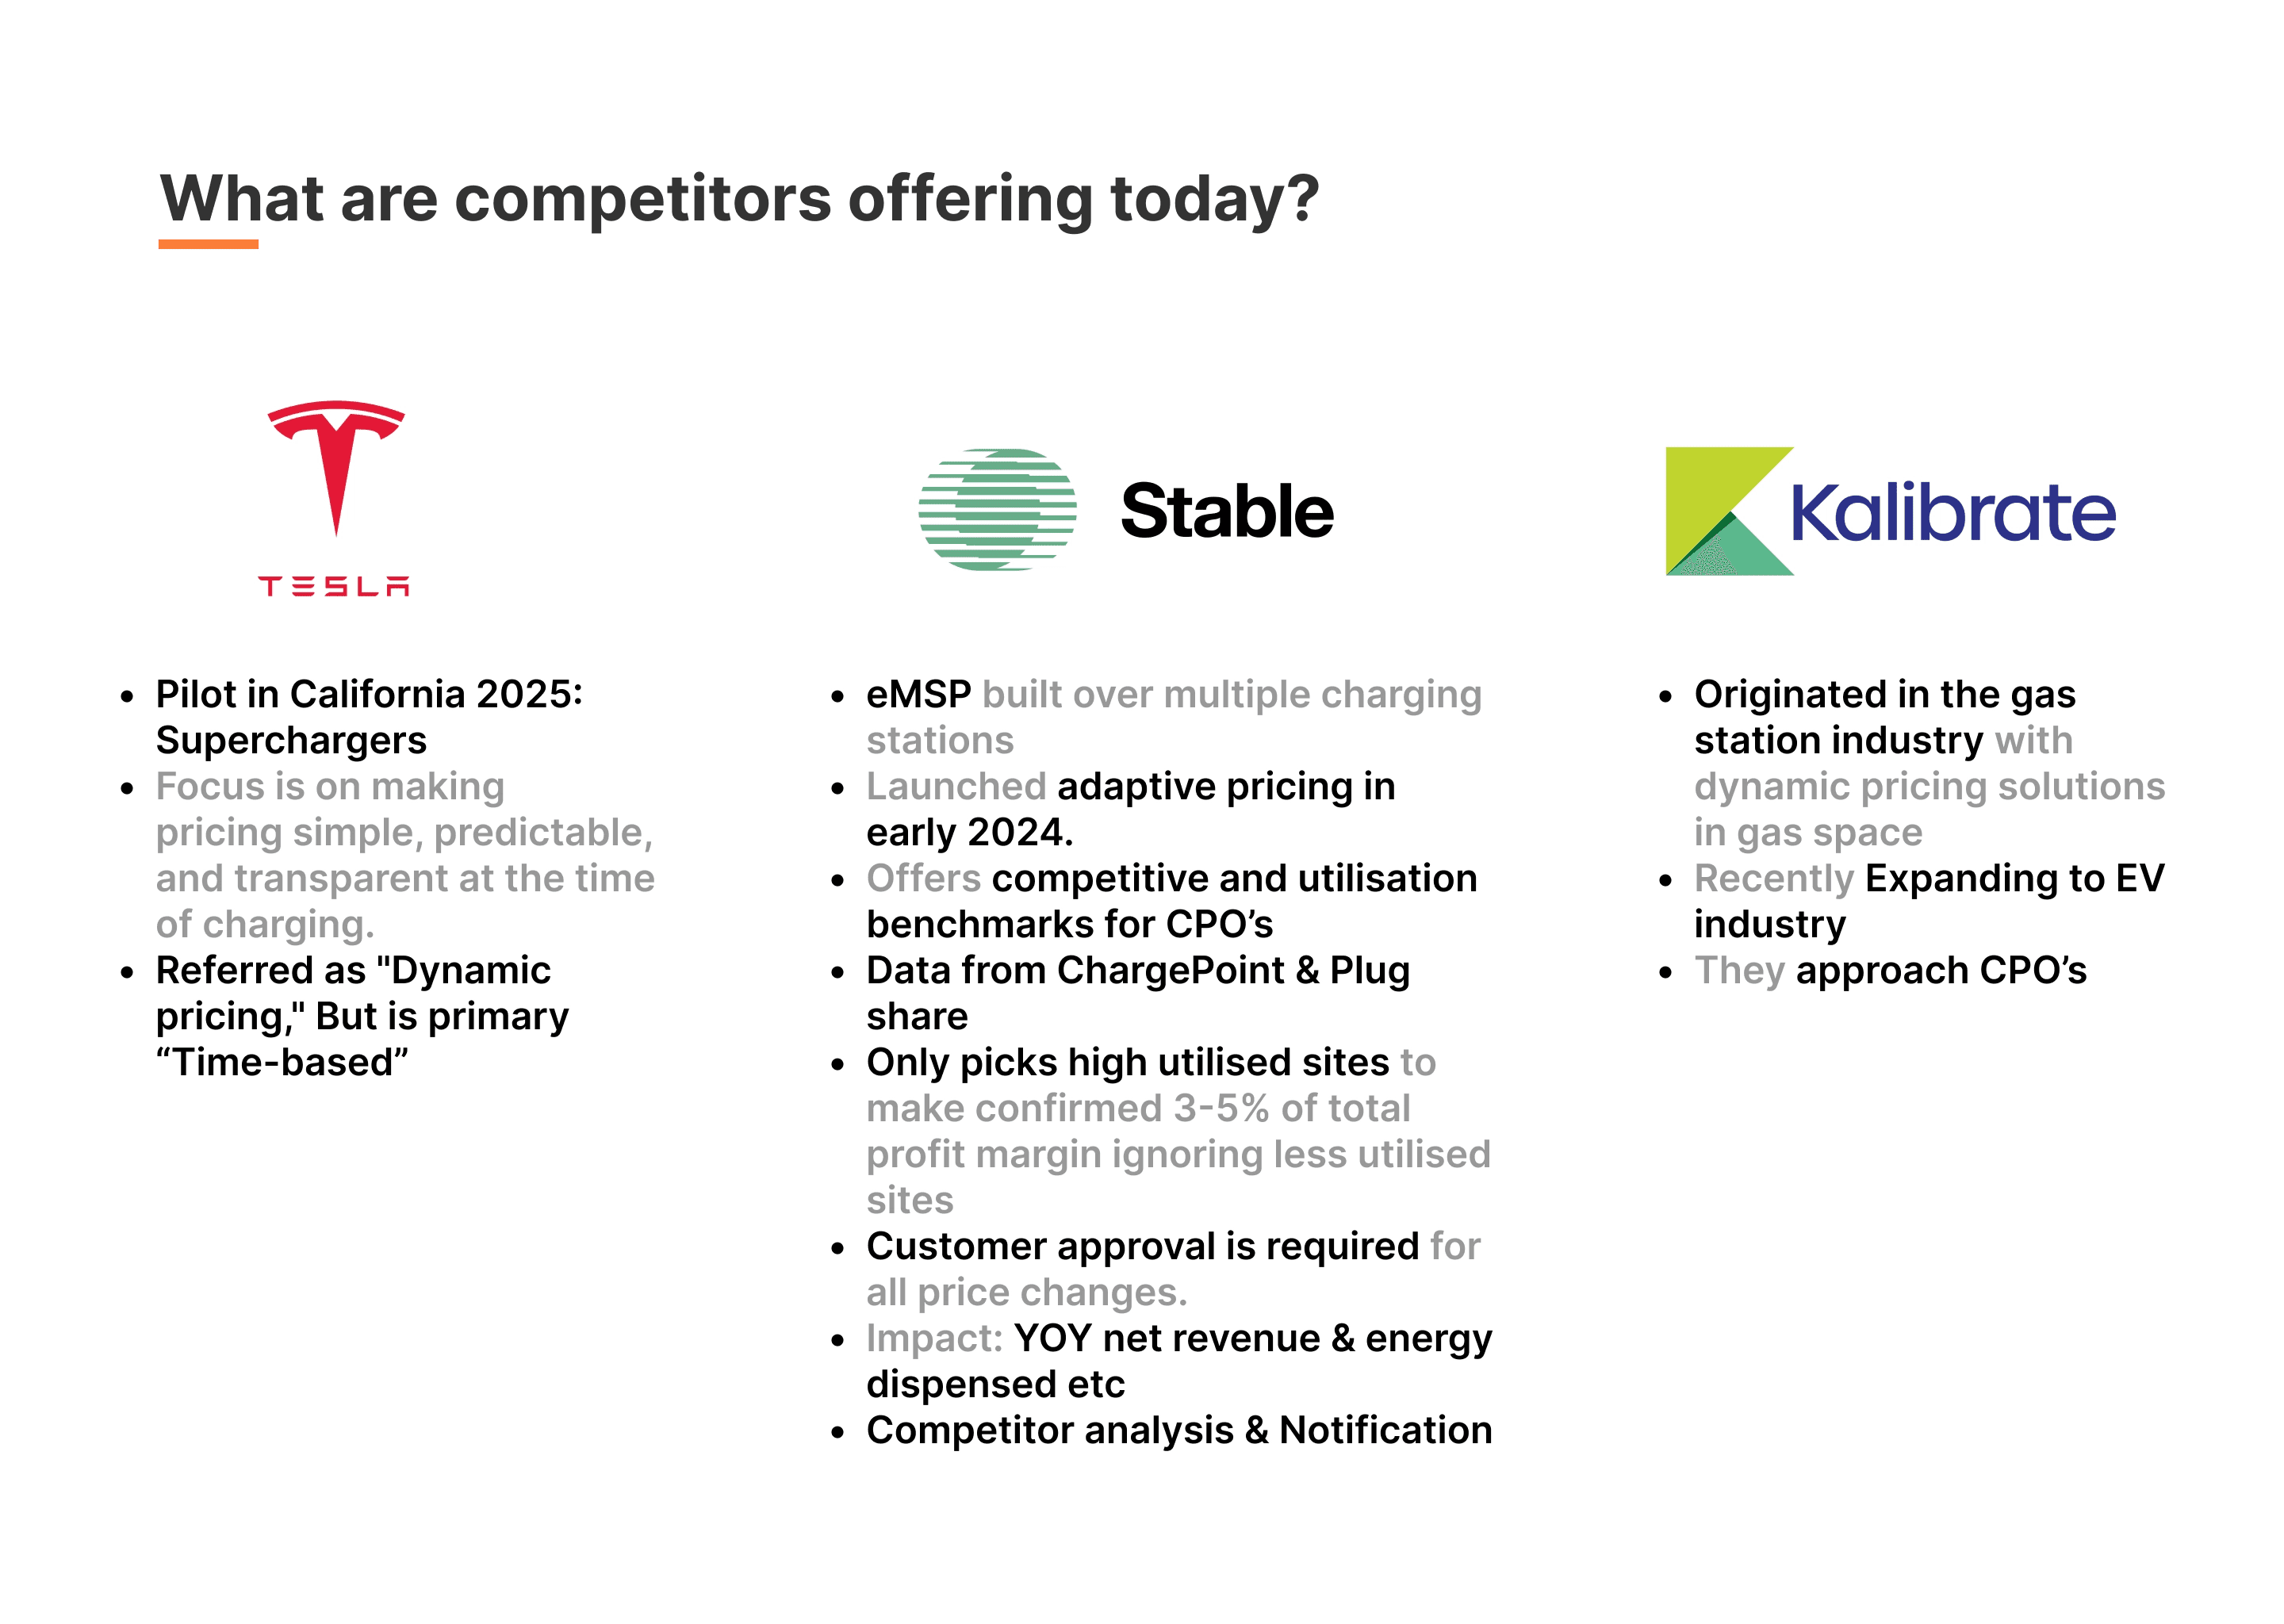
Competitors study

🎯 Optimisation Goals
Maximise revenue for station hosts (CPOs)
Stay competitive in the market without creating monopolistic pricing
Ensure fair and transparent pricing for drivers
Factors Driving Pricing
Factors | As a ChargePoint Owner, I want to.. | So that.. |
Revenue info | Understand Cost & Revenue & # of sessions I make from charging at an overall org level at any point of time | I ensure optimal business outcomes for my EV charging business |
Utilisation | Know Utilisation pattern on site level | I know
|
Utilisation | I would like to have a discounted price in my most idle time to drive more traffic to my sites | I can increase earning more revenue at my slowest time |
Utilisation | I would like to increase my charging price when I am experience high queues | I can balance queues and driver wait time |
Configuration | Get recommendations to change my pricing based on events around my site
| I can increase my revenue in this competitive neighbourhood https://www.caiso.com/todays-outlook/demand#section-current (Fetching details from Open API’s) |
Energy Cost & Demand charge | Have my CMS intelligently set a price that based on demand charge and energy cost | I can offset peak hours and reduce energy cost |
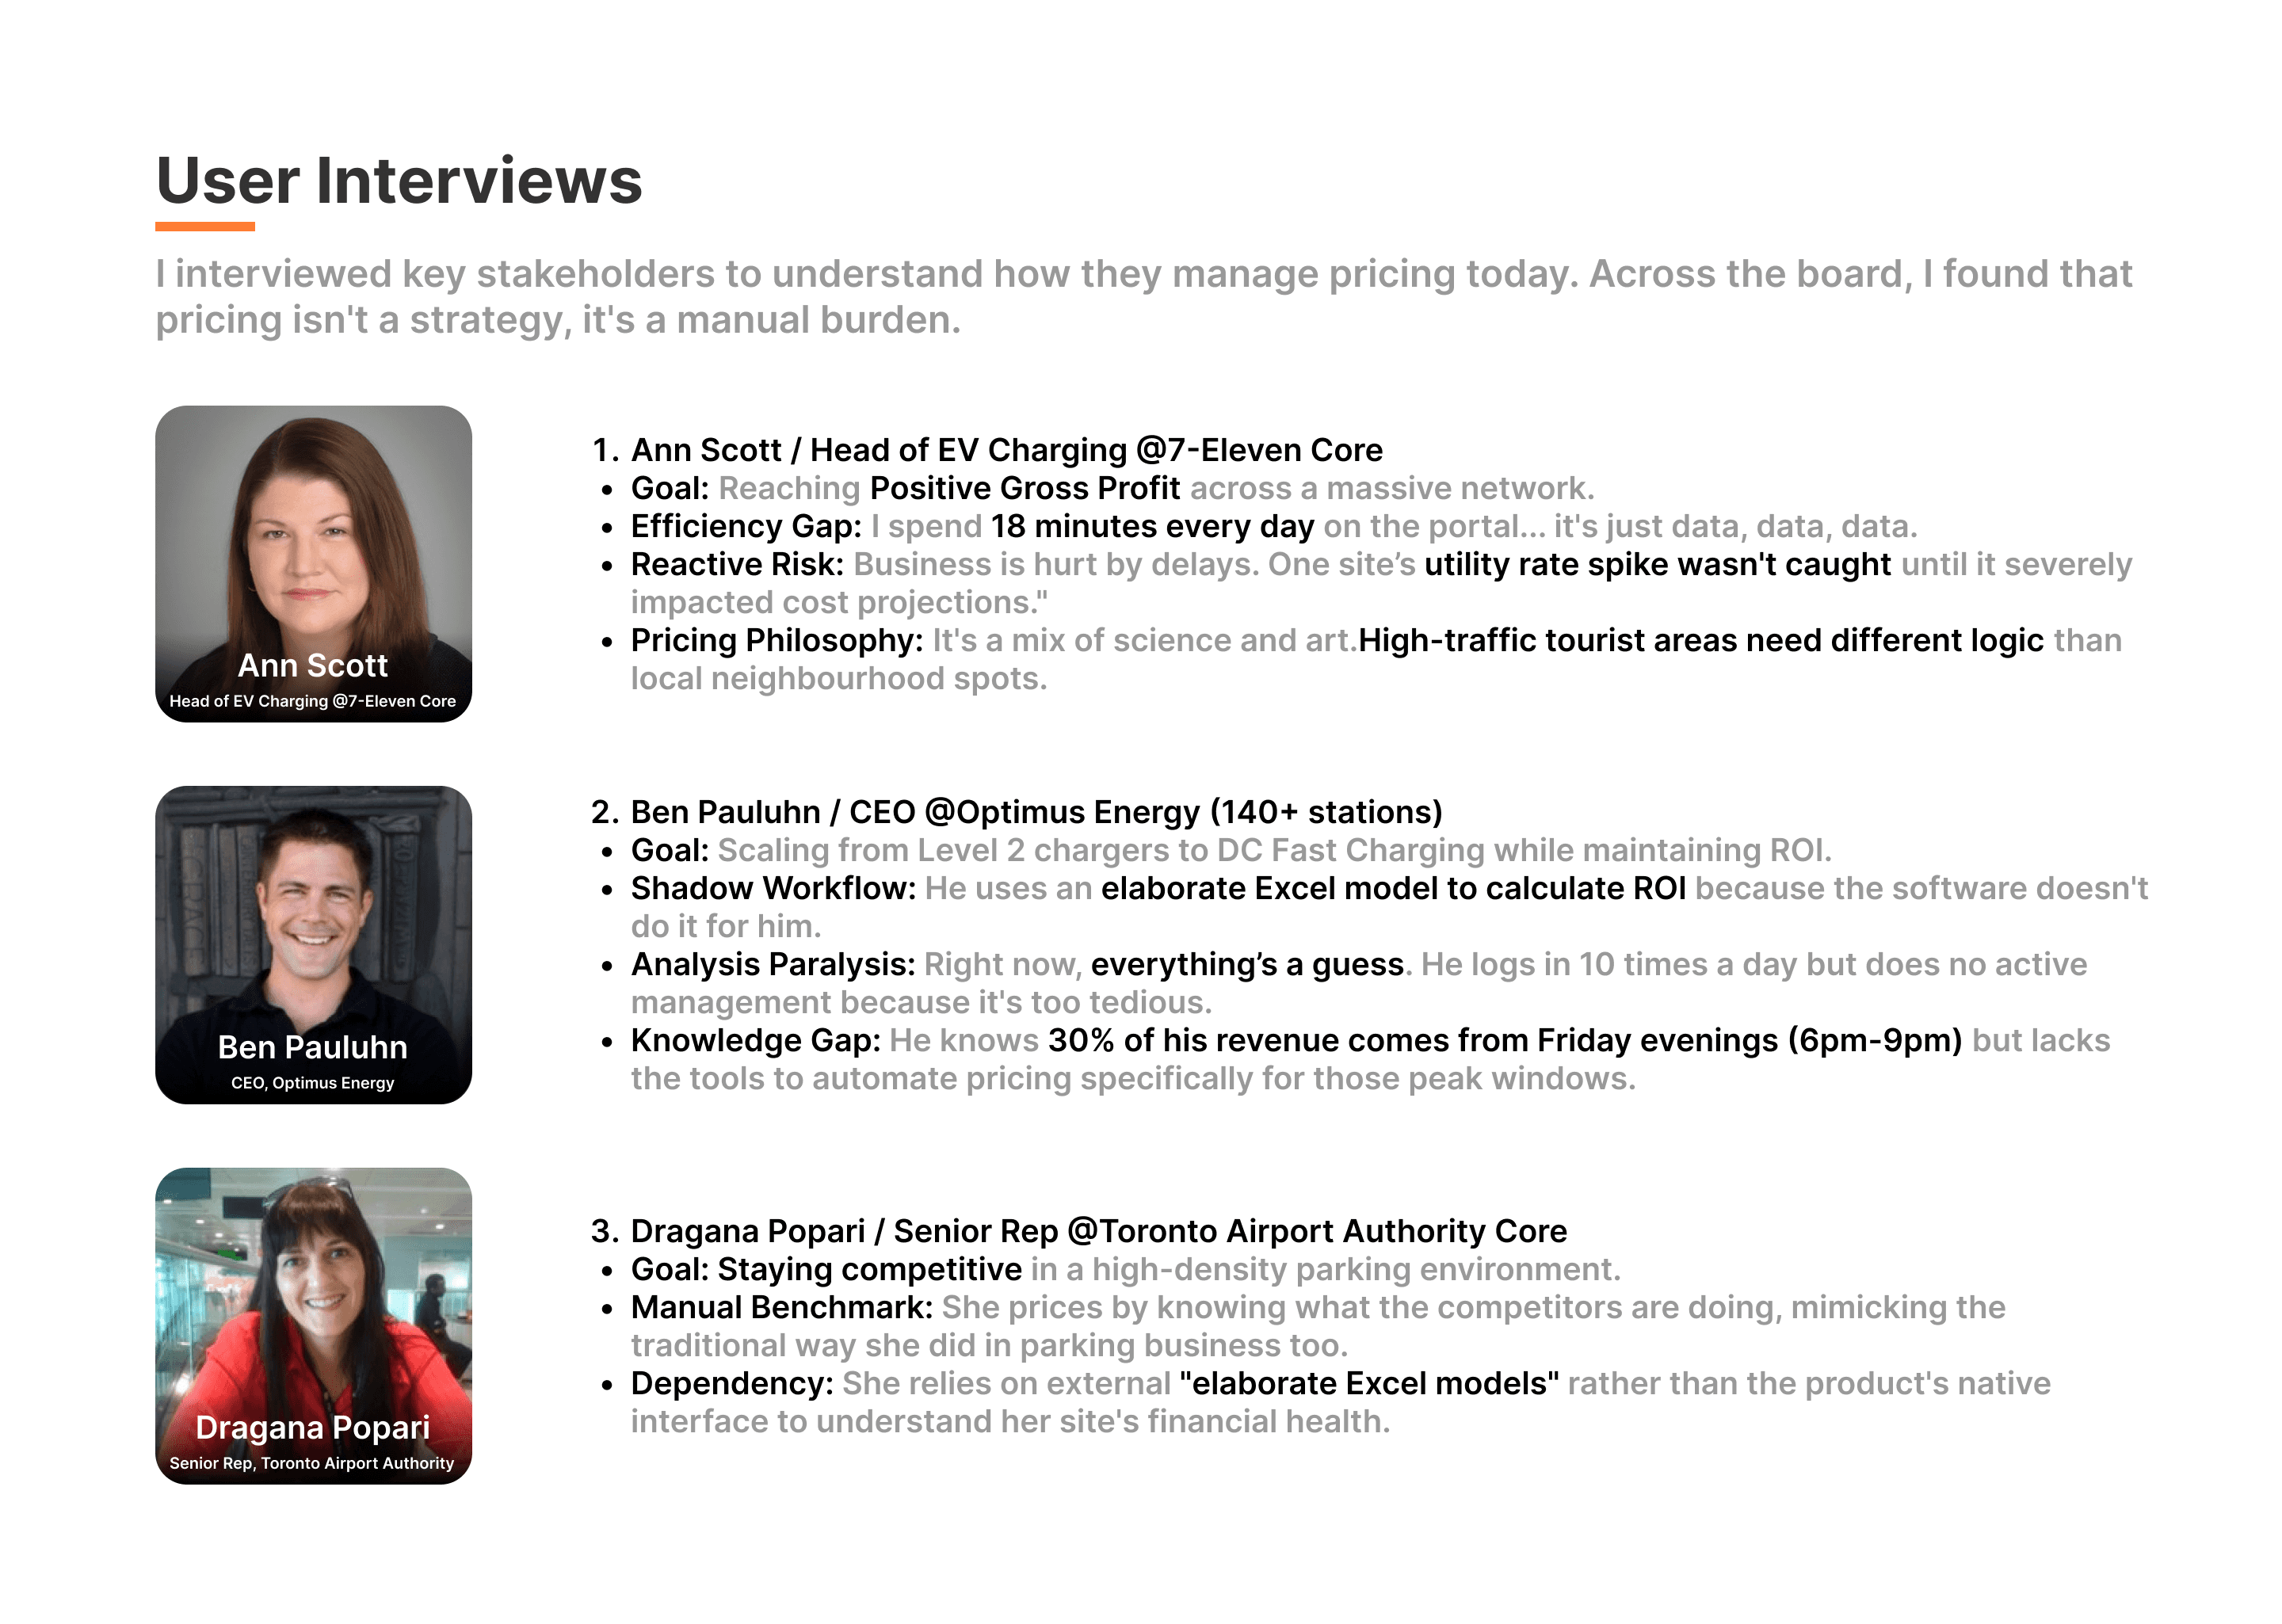
User story based on Interviews conducted
Theme/topic | As a ChargePoint Owner, I want to.. | So that.. | MVP Priority (MoSCoW) | Priority for user |
|---|---|---|---|---|
Insights/ KPI | have org level & site level insights on cost, revenue & Session level informations | I ensure optimal business outcomes for my EV charging business | Must have | P0 |
Insights/ KPI | see forecast of revenue generated based on potential pricing changes made on each sites | I can make data-driven decisions before applying them longterm settings | Could have | P0 |
Risk control | have guardrails for myself to play within so that I don’t make huge changes | I can control risks while experimenting with adaptive pricing | Need to have | P0 |
Experimentation | experiment with multiple pricing changes at specific sites | I can learn which strategies generate the most revenue over time. | Could have | P2 |
Update pricing | have alerts when a pricing rule negatively impacts revenue or sessions | I can act quickly to adjust to minimise losses | Could have | P2 |
Logs | view a history of pricing changes made at sites | I can revisit past adjustments, evaluate their results, or roll back if needed. | Could have | P2 |
Pricing schedule | want to schedule pricing changes in advance | I can align with peak hours, weekends, or events without any manual action from my side | Won’t have | P3 |
Automation | have configuration to choose balance between manual and automated pricing | I can decide how much my oversight is required for pricing changes | Could have | P3 |
Segment revenue | segmented data revenue performance by driver groups (e.g., my drivers vs. guests) | I can optimise pricing for different user types | Could have | P3 |
Solution 🌊
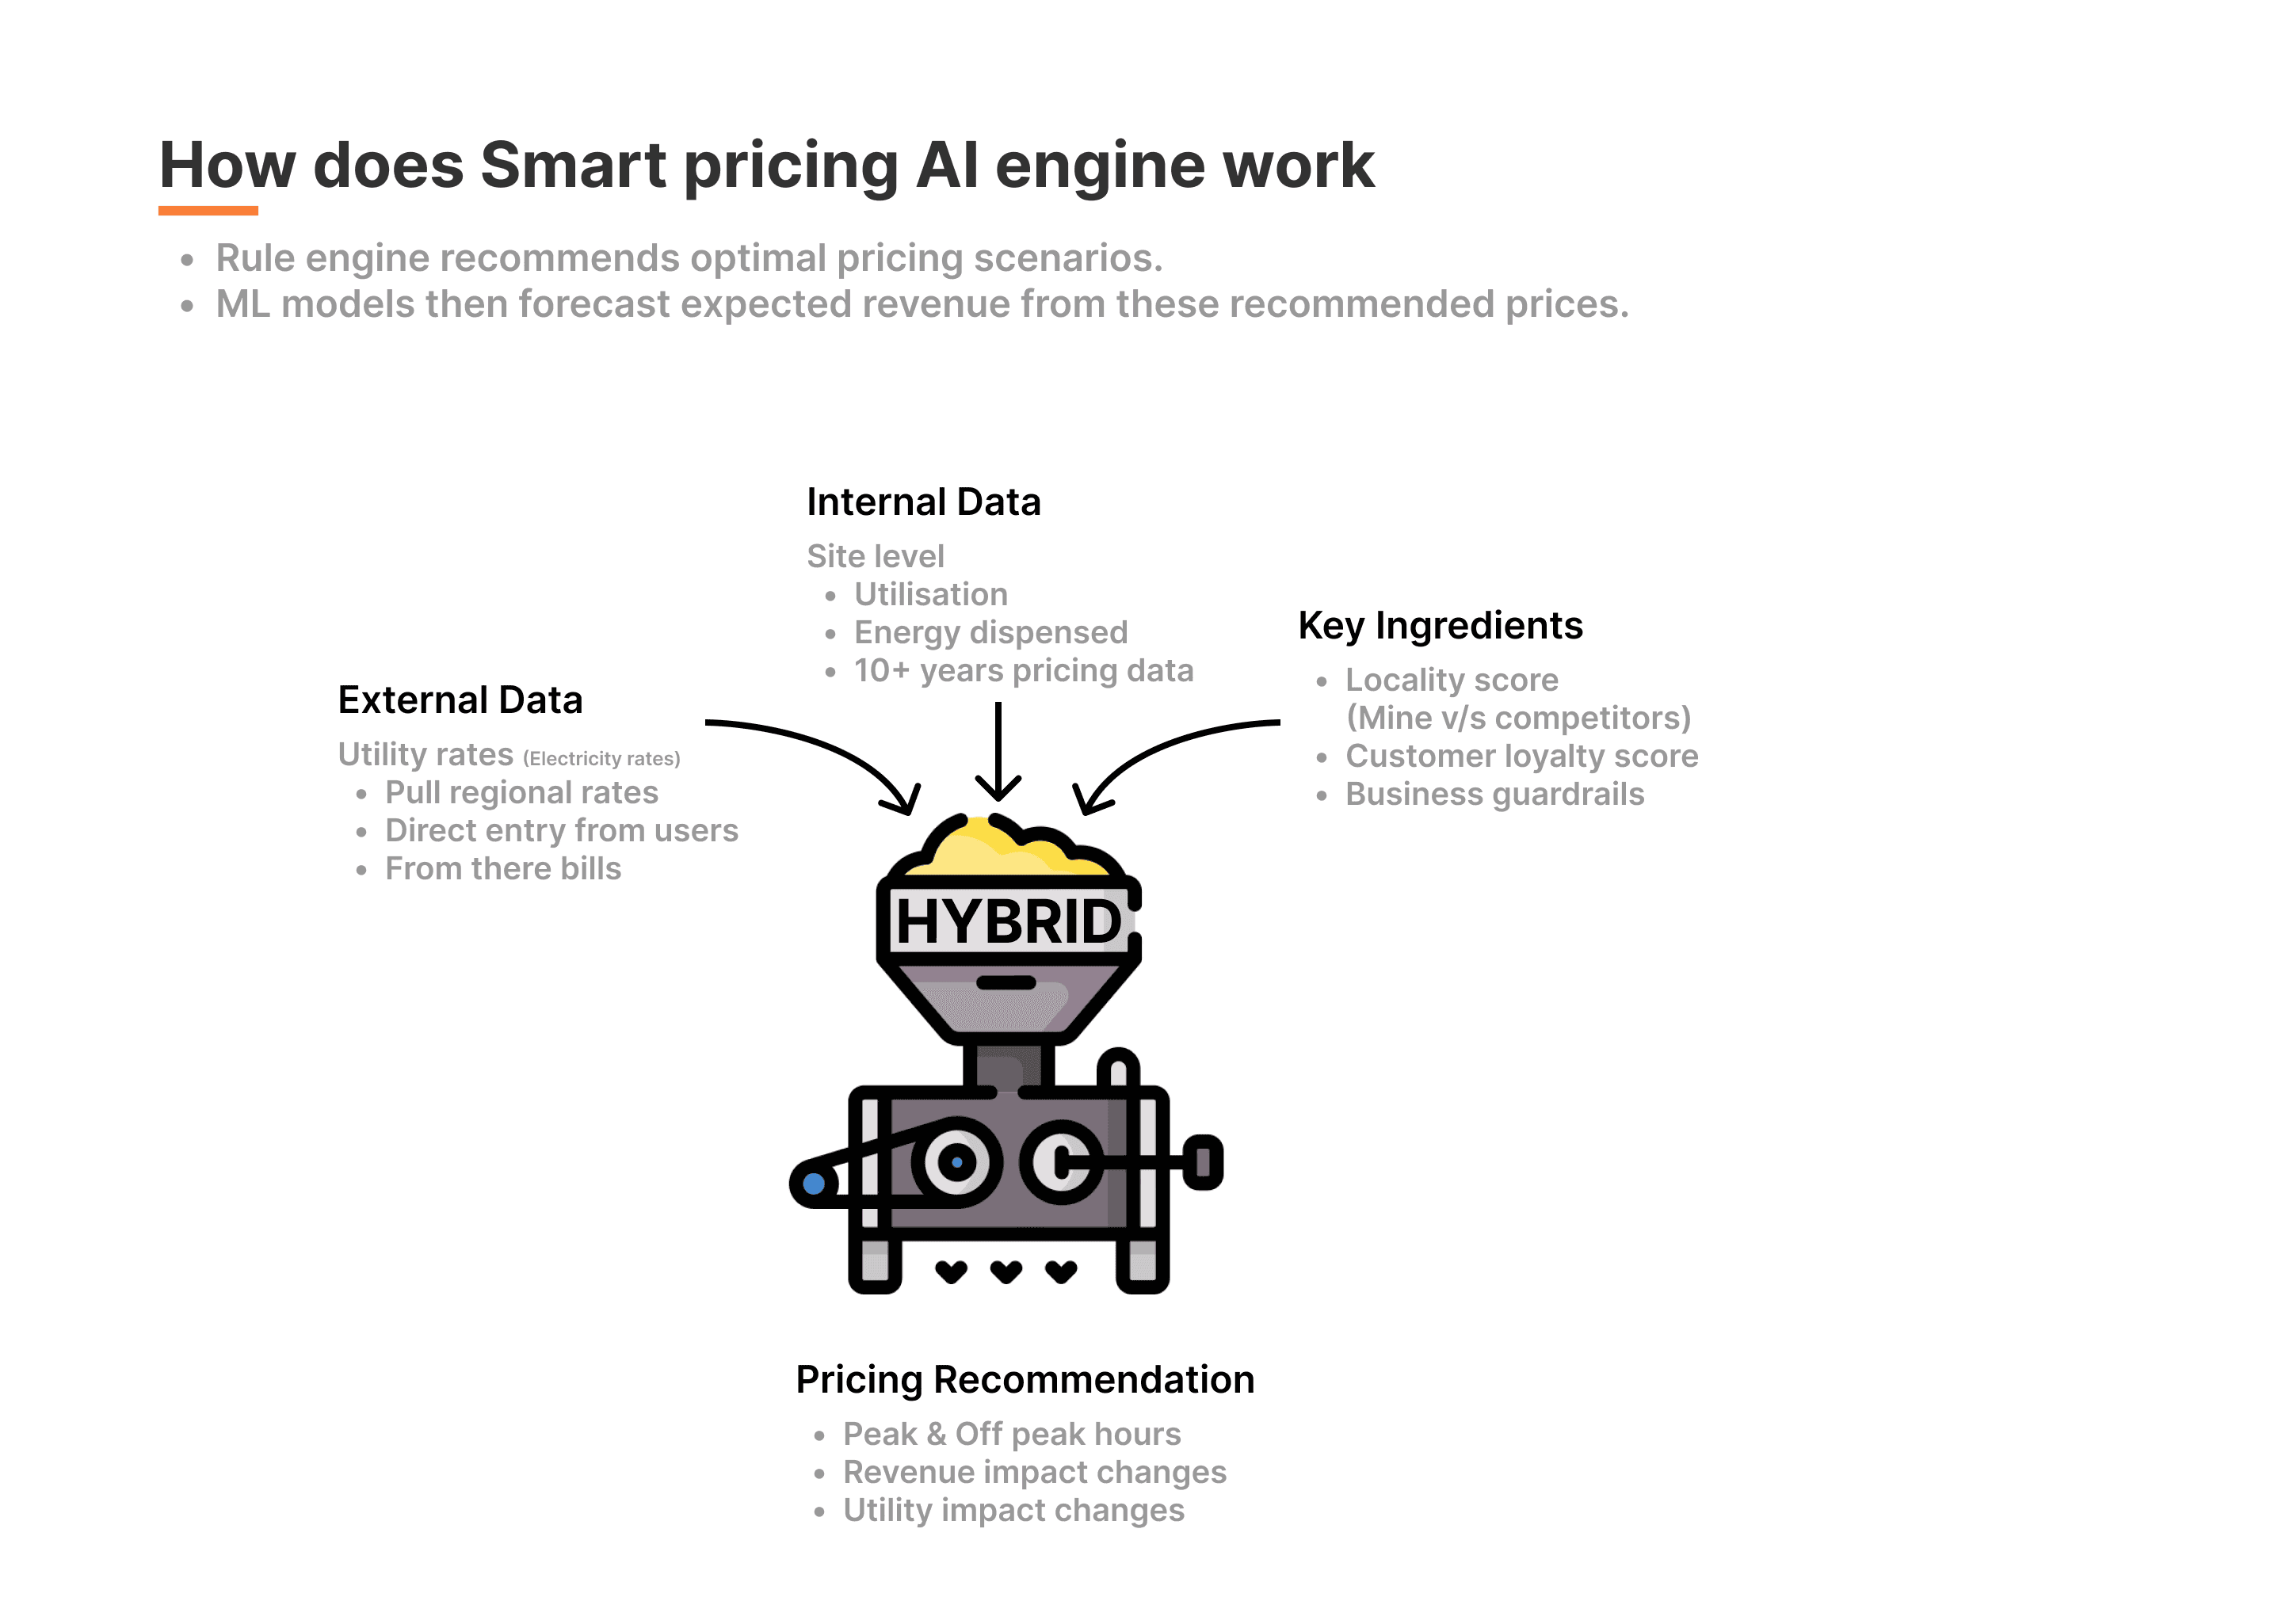
Hybrid Engine
Smart pricing would be a hybrid engine which combines rule-based components with machine learning (ML) models to forecast utilisation based on historical and contextual data.
Rule engine recommends optimal pricing scenarios.
ML models then forecast expected revenue from these recommended prices.
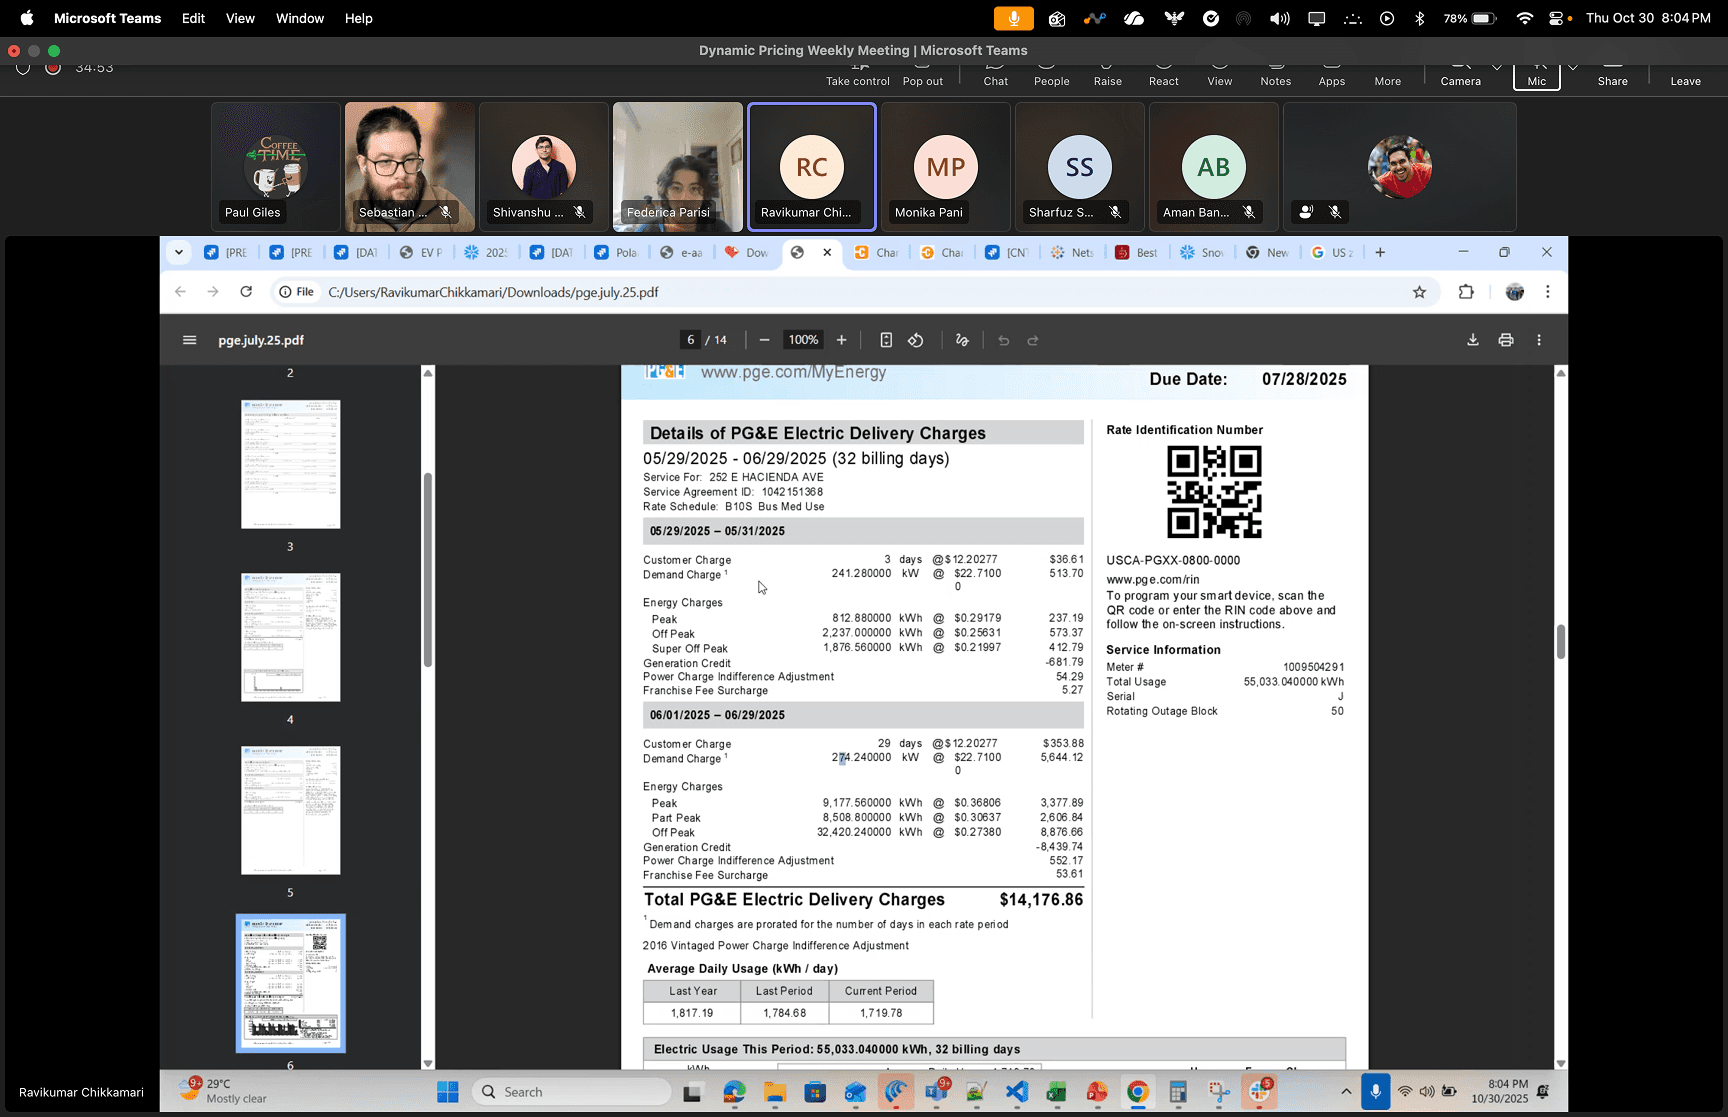
External (Electricity cost)
Option 1-Direct text Input of utility rate manually through a form
Option 2- Pre-filled Estimation: Pull regional rates via OpenEI API
Option 3 - Upload a PDF/CSV of the bill to identity Utility provider & Plans
Internal Data inputs (Site level)
Utilisation (sessions/time of day, occupancy)
Energy dispensed (kWh/session, peak kW)
Pricing history & previous experiments
Internal Data inputs (Site level)
Historical transaction data (10+ years available) - CP & Roaming
Key Ingredients: What Data We Use
The engine makes its decisions by analysing data points providing a unique insight into a station's performance and market position.
Data Category | Key Metrics | Business Question It Answers |
|---|---|---|
Station Performance | Current Utilisation, Current Price | How busy is the station right now? How are we priced today? |
Competitor Landscape | Neighbour Prices, Neighbour Locality Score (Google API data) | What are our competitors charging? Are their locations better or worse than ours? |
Location Quality | Station Locality Score (weightage model) | How good is our station's location interms of amenities (e.g., Cafe, hospital, highways, restaurants etc)? |
Customer Loyalty | Recurring Driver Ratio | Do we have a base of loyal, repeat customers at this station? |
Business Rules (Guardrails) | Utility Cost, Min/Max Price | What is our base cost for electricity? What are the absolute price boundaries we must operate within? |
Concierge MVP
Strategy to validate a business idea by manually delivering a highly personalised service to a small group of early users, rather than building an automated product immediately
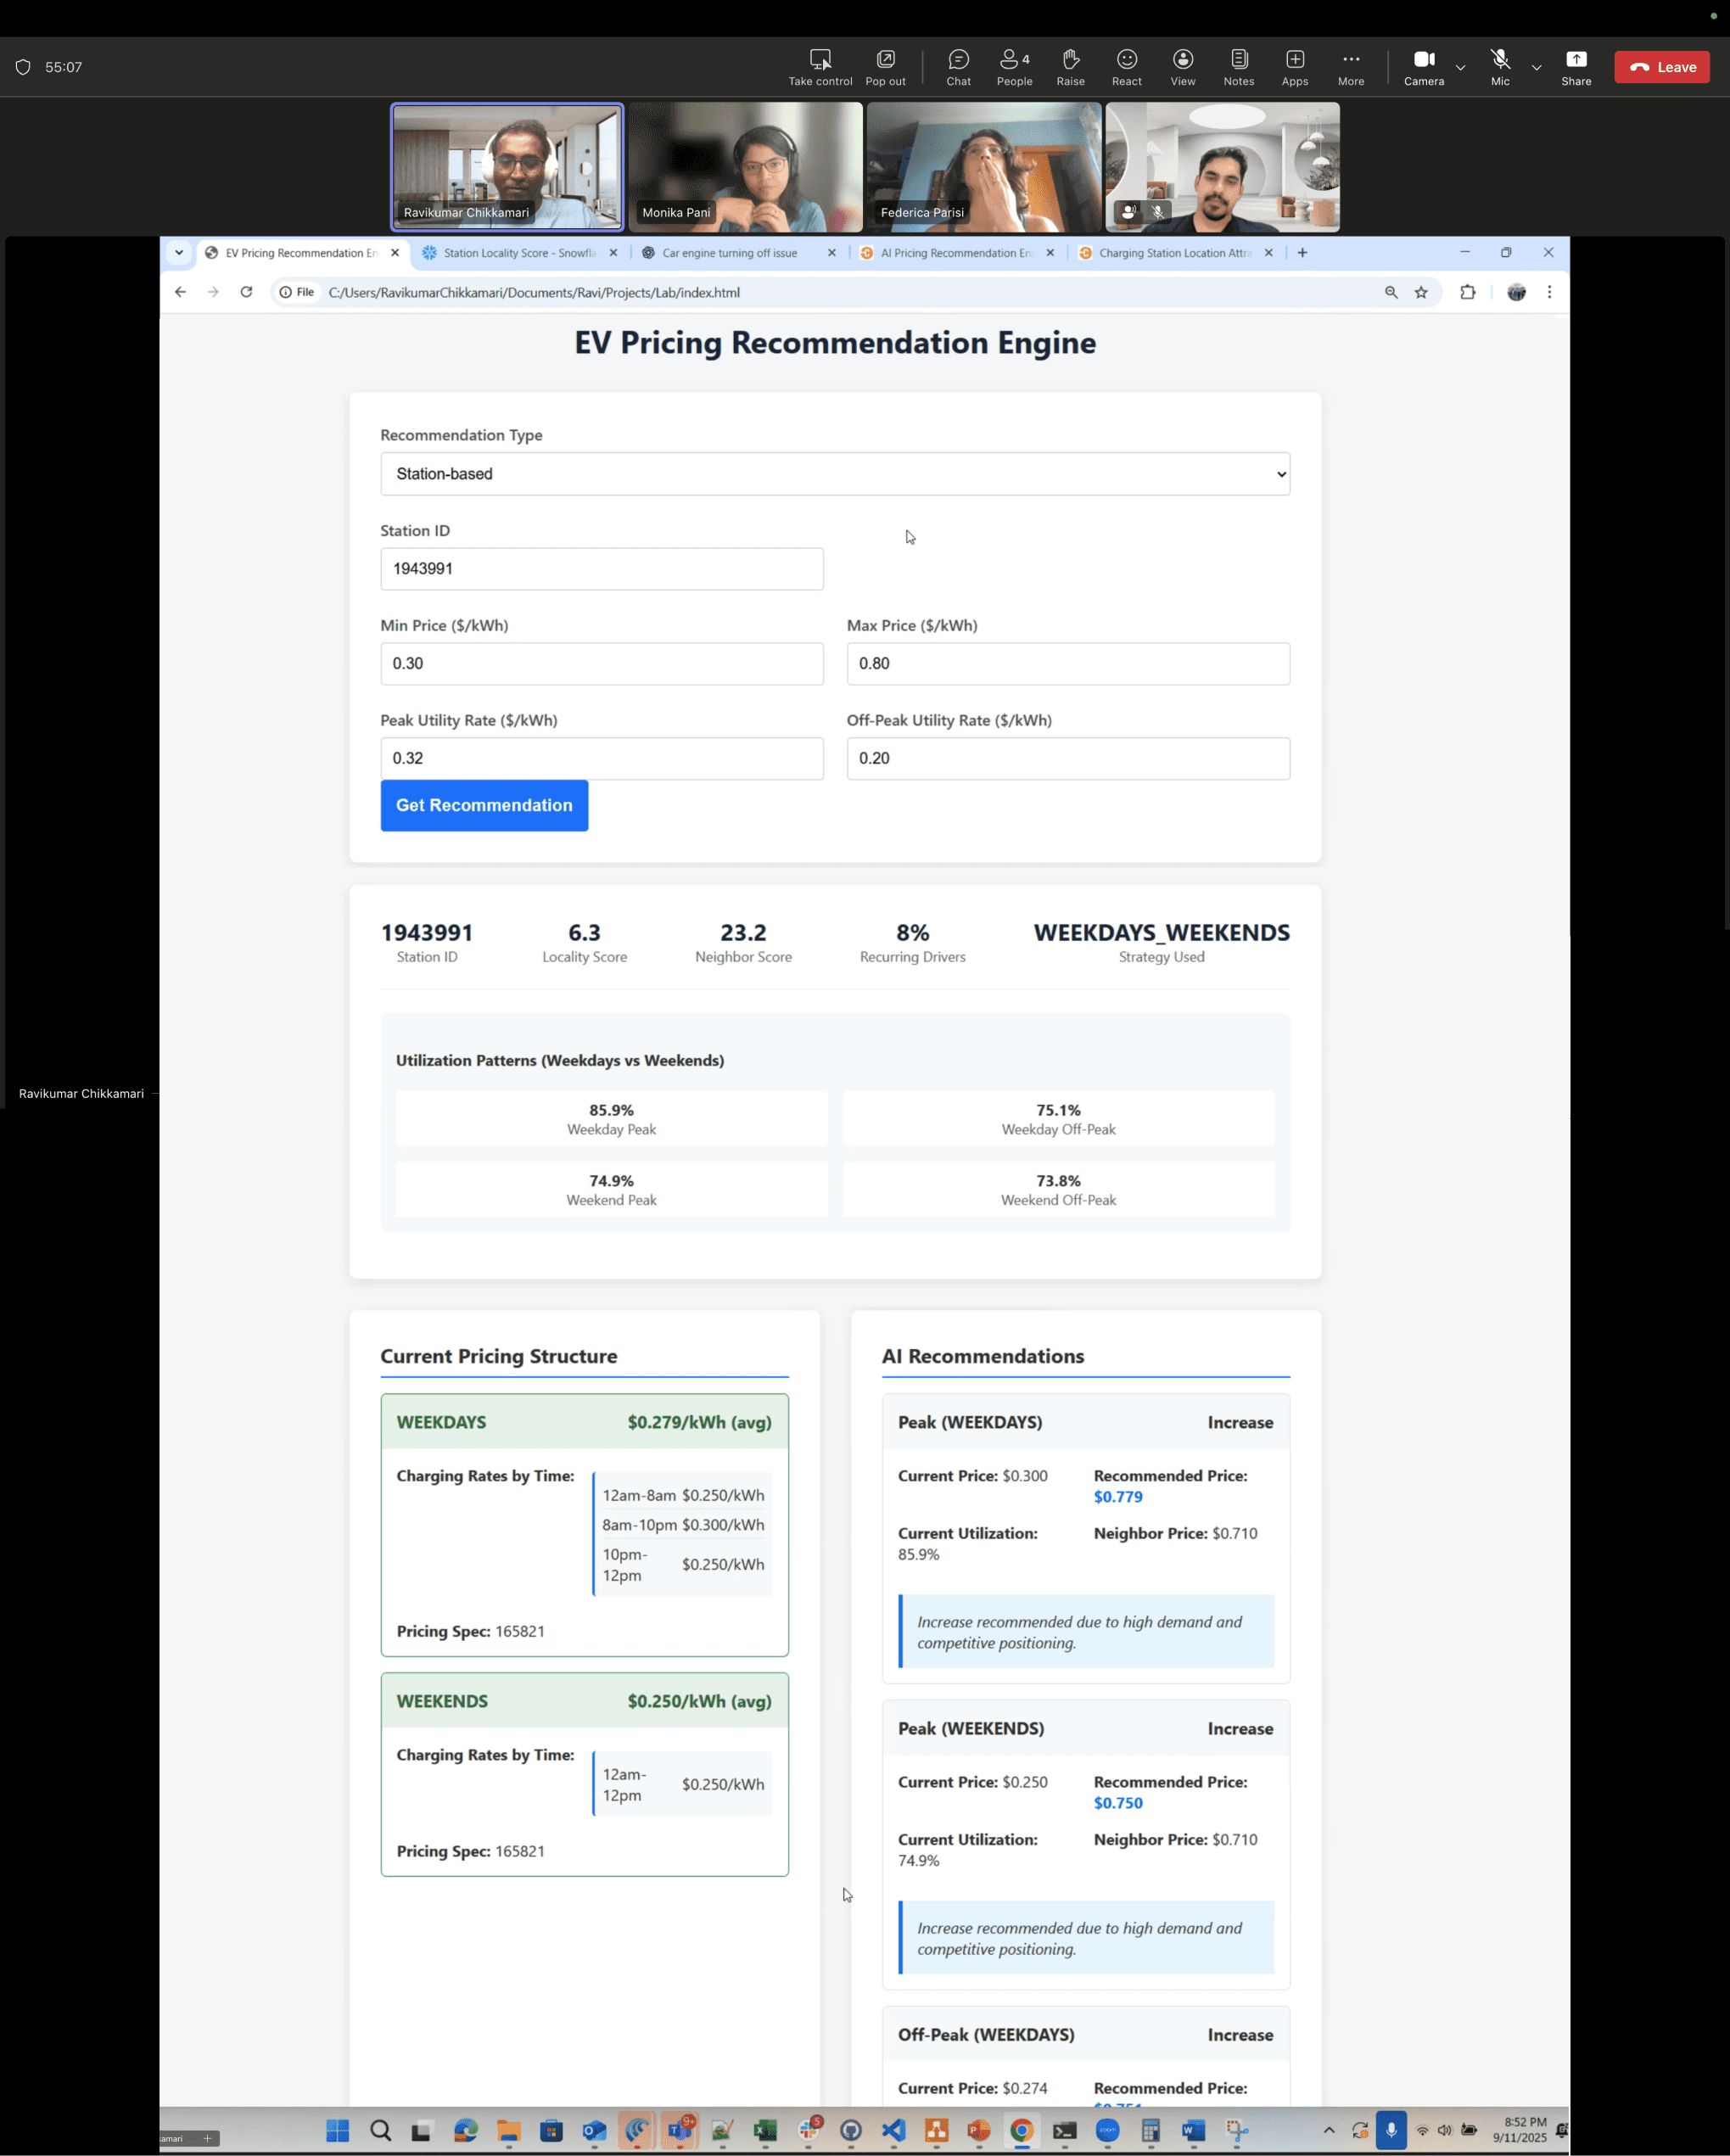
Figma Make Prototype:
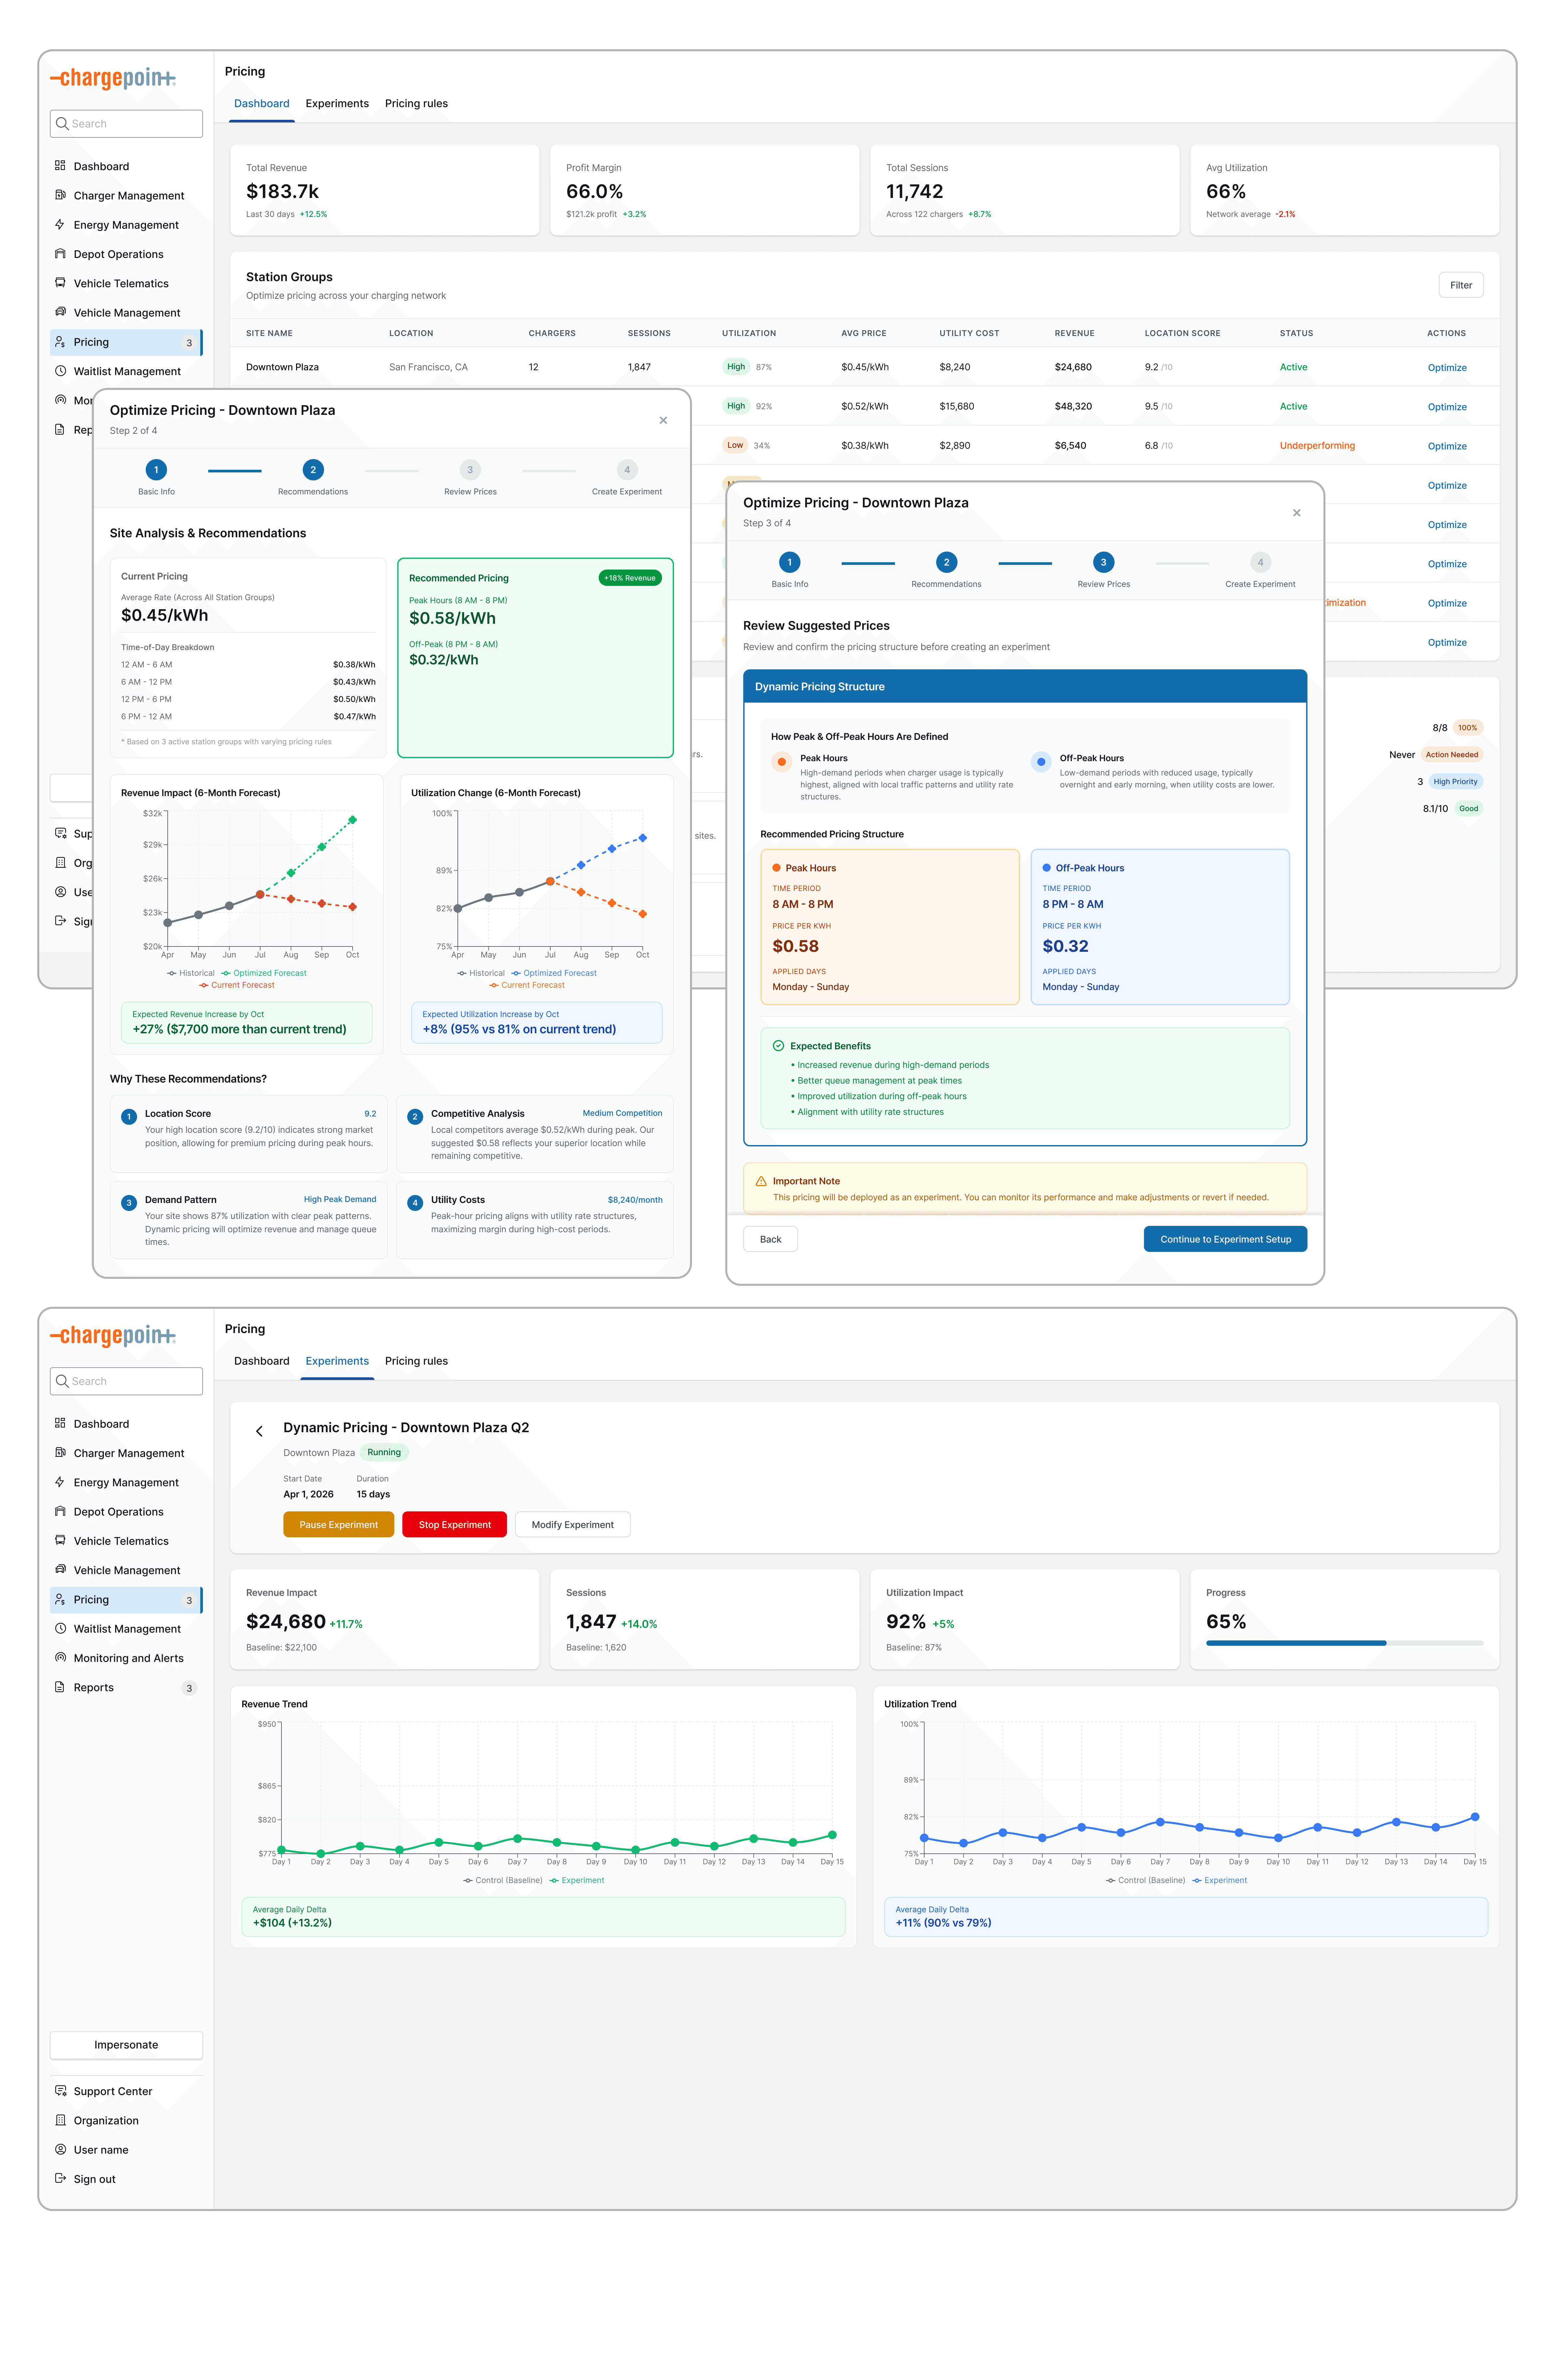
Problems v/s Solution
Problem (Manual static pricing) | Solution (AI recommended pricing) |
|---|---|
Make pricing decision based on only few input | Intelligent Dashboard automatically provides real-time market data, enabling informed decisions with minimal manual input |
Sites sit under-utilised at slow hours, get slammed at peak hours | Implementing variable pricing to incentivise off-peak usage and maximise revenue during high-demand windows. |
Station Hosts are not as savvy, Don’t want to to constantly monitor | Dynamic dashboard manages complex pricing logic on behalf of the host, removing the need for 24/7 oversight. |
Fear what if drivers don’t show up if price increased | Risk-Mitigated Experimentation to run time-bound experiments with a fail-safe option to revert instantly. |
Outcome ⚡️⚡️
Successfully validated the impact of the AI Pricing Engine through direct engagement with 3 key customers with 7% revenue increase in 3 weeks timeframe
Summary & Strategic Pivot
Collaboration
My collaboration with the Product Management team continued till March 2026, during which I spearheaded the early-stage ideation, core feature definition, and the foundational workflow architecture.
Organisational Restructuring,
In late March 2026, the organisation underwent a major restructuring that led to a shift in product priorities.
Validation
Despite the project being placed on hold, we successfully validated the impact of the AI Pricing Engine through direct engagement with 3 key customers via detailed calls and data analysis.
Technical Challenges
The pivot was further influenced by dependencies on a new data architecture.
The AI recommendation engine required precise "site definitions" to function. However, the manual migration of users from the legacy system to the new architecture took longer than anticipated. This underscored the importance of data readiness in AI-driven design.
Future plan
The qualitative feedback from 3 customers confirmed that our design direction was sound, even as the implementation was rescheduled for future quarters.
Conclusion
While the company later shifted its strategic focus, this case study serves as a definitive record of the vision, solutions, and design systems I established during this phase.
It captures a robust design framework built to solve complex pricing and editing challenges in a competitive market.

